Negomir Facts
| Area | 61.2 km² |
| Population | 3,288 |
| Male Population | 1,684 (51.2%) |
| Female Population | 1,604 (48.8%) |
| Population change (1975 to 2020) | -28.3% |
| Population change (2000 to 2020) | -21.6% |
| Median Age | 37.5 years (Male: 36.5, Female: 38.8) |
| GDP per capita (PPP) | $25,488 (2022) |
| Local Time | |
| Timezone | Eastern European Summer Time |
| Lat & Lng | 44.83333, 23.16667 |
| Postal Codes | 217310 |
Map of Negomir
Interactive Map
Negomir Population
Years 1975 to 2030
| Data | 1975 | 1990 | 2000 | 2015 | 2020 | 2025* | 2030* |
|---|---|---|---|---|---|---|---|
| Population | 4,586 | 4,661 | 4,196 | 3,138 | 3,288 | 3,228 | 3,079 |
| Population Density | 74.9 / km² | 76.2 / km² | 68.6 / km² | 51.3 / km² | 53.7 / km² | 52.8 / km² | 50.3 / km² |
Negomir Population change from 2000 to 2020
Decrease of 21.6% from year 2000 to 2020
| Location | Change since 1975 | Change since 1990 | Change since 2000 |
|---|---|---|---|
| Negomir | -28.3% | -29.5% | -21.6% |
| Gorj County | — | — | — |
| Romania | — | — | — |
Negomir Median Age
Median Age: 37.5 years
| Location | Median Age | Median Age (Female) | Median Age (Male) |
|---|---|---|---|
| Negomir | 37.5 yrs | 38.8 yrs | 36.5 yrs |
| Gorj County | 40.1 yrs | 41.1 yrs | 38.8 yrs |
| Romania | 40.1 yrs | 41.6 yrs | 38.5 yrs |
Negomir Population Density
Population Density: 53.7 / km²
| Location | Population | Area | Density |
|---|---|---|---|
| Negomir | 3,288 | 61.2 km² | 53.7 / km² |
| Gorj County | 302,662 | 5,605.7 km² | 54 / km² |
| Romania | 19.5 million | 238,387.8 km² | 81.8 / km² |
Negomir Historical and Projected Population
Estimated Population from 0 to 2100
- JRC (European Commission's Joint Research Centre) work on the GHS built-up grid
- CIESIN (Center for International Earth Science Information Network)
- [Link] Klein Goldewijk, K., Beusen, A., Doelman, J., and Stehfest, E.: Anthropogenic land use estimates for the Holocene – HYDE 3.2, Earth Syst. Sci. Data, 9, 927–953, https://doi.org/10.5194/essd-9-927-2017, 2017.
Human Development Index (HDI)
Statistic composite index of life expectancy, education, and per capita income.
Negomir Gross Domestic Product (GDP)
GDP per capita, PPP (constant 2017 international $)
| Data | 1990 | 1995 | 2000 | 2005 | 2010 | 2015 | 2020 | 2022 |
|---|---|---|---|---|---|---|---|---|
| GDP per capita | $10,710 | $8,487 | $7,609 | $13,798 | $13,988 | $17,649 | $23,896 | $25,488 |
| Total GDP | $217.8M | $165M | $141.6M | $240.9M | $229.4M | $278.7M | $357.6M | $377.9M |
Negomir CO2 Emissions
Carbon Dioxide (CO2) Emissions Per Capita in Tonnes Per Year
| Location | CO2 Emissions | CO2 Emissions Per Capita | CO2 Emissions Intensity |
|---|---|---|---|
| Negomir | 14,910 tn | 4.53 tn | 243.7 tons/km² |
| Gorj County | 1,374,343 tn | 4.54 tn | 245.2 tons/km² |
| Romania | 86,961,323 tn | 4.46 tn | 364.8 tons/km² |
| 2013 CO2 emissions (tonnes/year) | 14,910 tn |
| 2013 CO2 emissions (tonnes/year) per capita | 4.53 tn |
| 2013 CO2 emissions intensity (tonnes/km²/year) | 243.7 tons/km² |
Natural Hazards Risk
Relative risk out of 10
| Hazard | Risk Level |
|---|---|
| Flood | Medium (4) |
| Earthquake | Medium (4) |
* Risk, particularly concerning flood or landslide, may not be for the entire area.
- Dilley, M., R.S. Chen, U. Deichmann, A.L. Lerner-Lam, M. Arnold, J. Agwe, P. Buys, O. Kjekstad, B. Lyon, and G. Yetman. 2005. Natural Disaster Hotspots: A Global Risk Analysis. Washington, D.C.: World Bank. https://doi.org/10.1596/0-8213-5930-4.
- Center for Hazards and Risk Research - CHRR - Columbia University, Center for International Earth Science Information Network - CIESIN - Columbia University. 2005. Global Flood Hazard Frequency and Distribution. Palisades, NY: NASA Socioeconomic Data and Applications Center (SEDAC). https://doi.org/10.7927/H4668B3D.
- Center for Hazards and Risk Research - CHRR - Columbia University, Center for International Earth Science Information Network - CIESIN - Columbia University. 2005. Global Earthquake Hazard Distribution - Peak Ground Acceleration. Palisades, NY: NASA Socioeconomic Data and Applications Center (SEDAC). https://doi.org/10.7927/H4BZ63ZS.
Recent Nearby Earthquakes
Magnitude 3.0 and greater
| Date▼ | Time↕ | Magnitude↕ | Distance↕ | Depth↕ | Location↕ | Link |
|---|---|---|---|---|---|---|
| 12/29/15 | 6:56 PM | 4.3 | 98.6 km | 27,160 m | 7km WNW of Brezoi, Romania | usgs.gov |
| 10/31/14 | 11:00 PM | 4.1 | 78.2 km | 4,100 m | 1km NNE of Teregova, Romania | usgs.gov |
| 9/8/13 | 1:22 PM | 4.6 | 89.5 km | 5,000 m | 1km WSW of Unirea, Romania | usgs.gov |
| 9/8/13 | 1:00 PM | 4.3 | 86.7 km | 10,000 m | 2km NNE of Totesti, Romania | usgs.gov |
| 1/1/12 | 11:57 PM | 4.5 | 36.7 km | 6,000 m | Romania | usgs.gov |
| 7/10/08 | 4:13 PM | 3.4 | 39 km | 11,300 m | Romania | usgs.gov |
| 6/27/08 | 11:24 AM | 3.3 | 21.9 km | 20,700 m | Romania | usgs.gov |
| 10/10/07 | 6:59 AM | 3 | 37 km | 6,500 m | Romania | usgs.gov |
| 7/13/07 | 11:17 AM | 3 | 35.1 km | 5,100 m | Romania | usgs.gov |
| 8/10/06 | 7:19 AM | 3.4 | 62.8 km | 0 m | Romania | usgs.gov |
Negomir
Negomir is a commune in Gorj County, Romania. It is composed of ten villages: Artanu, Bohorel, Condeieşti, Negomir, Nucetu, Orzu, Paltinu, Raci, Ursoaia and Valea Racilor.
Negomir Wikipedia Page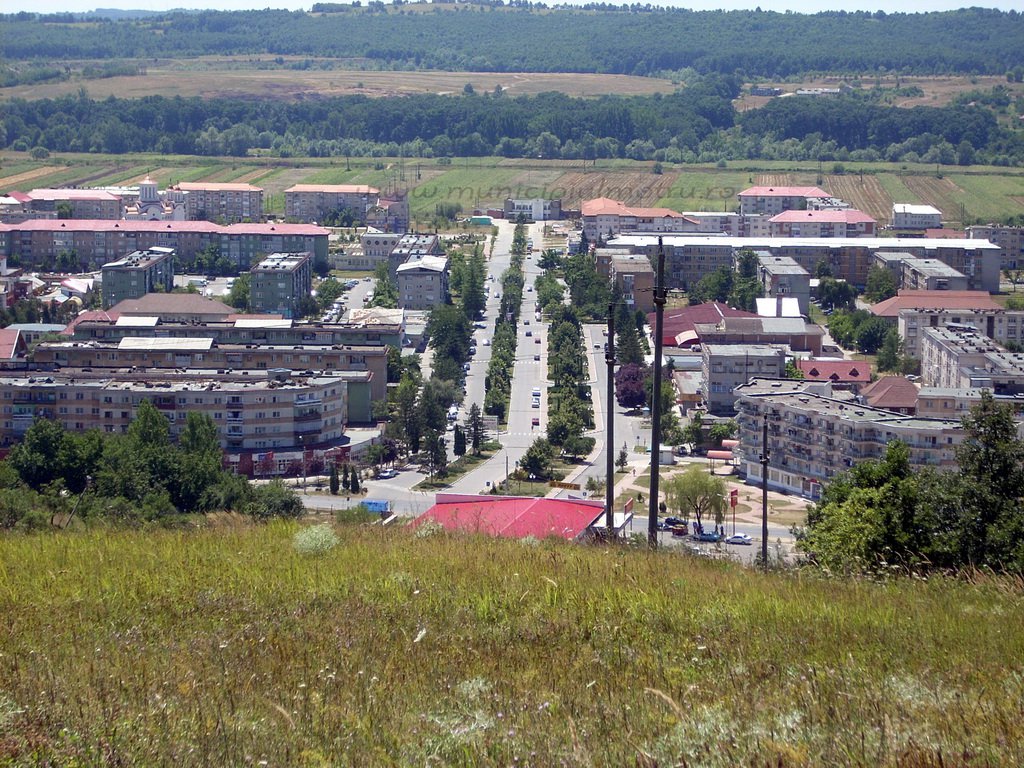

About Our Data
The data on this page is estimated using a number of publicly available tools and resources. It is provided without warranty, and could contain inaccuracies. Use at your own risk.