Tarcea Facts
| Area | 1.6 km² |
| Population | 446 |
| Male Population | 227 (50.9%) |
| Female Population | 219 (49.1%) |
| Population change (1975 to 2020) | -63.6% |
| Population change (2000 to 2020) | -59.0% |
| Median Age | 37.5 years (Male: 36.2, Female: 38.9) |
| GDP per capita (PPP) | $21,019 (2022) |
| Local Time | |
| Timezone | Eastern European Summer Time |
| Lat & Lng | 47.45000, 22.18333 |
| Postal Codes | 417570 |
Map of Tarcea
Interactive Map
Tarcea Population
Years 1975 to 2030
| Data | 1975 | 1990 | 2000 | 2015 | 2020 | 2025* | 2030* |
|---|---|---|---|---|---|---|---|
| Population | 1,224 | 1,287 | 1,087 | 841 | 446 | 426 | 406 |
| Population Density | 783.4 / km² | 823.7 / km² | 695.7 / km² | 538.2 / km² | 285.4 / km² | 272.6 / km² | 259.8 / km² |
Tarcea Population change from 2000 to 2020
Decrease of 59% from year 2000 to 2020
| Location | Change since 1975 | Change since 1990 | Change since 2000 |
|---|---|---|---|
| Tarcea | -63.6% | -65.3% | -59% |
| Bihor County | — | — | — |
| Romania | — | — | — |
Tarcea Median Age
Median Age: 37.5 years
| Location | Median Age | Median Age (Female) | Median Age (Male) |
|---|---|---|---|
| Tarcea | 37.5 yrs | 38.9 yrs | 36.2 yrs |
| Bihor County | 39.1 yrs | 40.8 yrs | 37.5 yrs |
| Romania | 40.1 yrs | 41.6 yrs | 38.5 yrs |
Tarcea Population Density
Population Density: 285 / km²
| Location | Population | Area | Density |
|---|---|---|---|
| Tarcea | 446 | 1.563 km² | 285 / km² |
| Bihor County | 525,688 | 7,546.5 km² | 69.7 / km² |
| Romania | 19.5 million | 238,387.8 km² | 81.8 / km² |
Tarcea Historical and Projected Population
Estimated Population from 0 to 2100
- JRC (European Commission's Joint Research Centre) work on the GHS built-up grid
- CIESIN (Center for International Earth Science Information Network)
- [Link] Klein Goldewijk, K., Beusen, A., Doelman, J., and Stehfest, E.: Anthropogenic land use estimates for the Holocene – HYDE 3.2, Earth Syst. Sci. Data, 9, 927–953, https://doi.org/10.5194/essd-9-927-2017, 2017.
Human Development Index (HDI)
Statistic composite index of life expectancy, education, and per capita income.
Tarcea Gross Domestic Product (GDP)
GDP per capita, PPP (constant 2017 international $)
| Data | 1990 | 1995 | 2000 | 2005 | 2010 | 2015 | 2020 | 2022 |
|---|---|---|---|---|---|---|---|---|
| GDP per capita | $7,734 | $6,547 | $6,829 | $12,941 | $14,904 | $15,004 | $18,213 | $21,019 |
| Total GDP | $21.5M | $18.2M | $19.1M | $36.1M | $41.4M | $42.2M | $50.4M | $58.5M |
Tarcea CO2 Emissions
Carbon Dioxide (CO2) Emissions Per Capita in Tonnes Per Year
| Location | CO2 Emissions | CO2 Emissions Per Capita | CO2 Emissions Intensity |
|---|---|---|---|
| Tarcea | 2,151 tn | 4.82 tn | 1,376.8 tons/km² |
| Bihor County | 2,547,055 tn | 4.85 tn | 337.5 tons/km² |
| Romania | 86,961,323 tn | 4.46 tn | 364.8 tons/km² |
| 2013 CO2 emissions (tonnes/year) | 2,151 tn |
| 2013 CO2 emissions (tonnes/year) per capita | 4.82 tn |
| 2013 CO2 emissions intensity (tonnes/km²/year) | 1,376.8 tons/km² |
Natural Hazards Risk
Relative risk out of 10
| Hazard | Risk Level |
|---|---|
| Drought | Low (2) |
| Flood | High (10) |
| Earthquake | Medium (4) |
* Risk, particularly concerning flood or landslide, may not be for the entire area.
- Dilley, M., R.S. Chen, U. Deichmann, A.L. Lerner-Lam, M. Arnold, J. Agwe, P. Buys, O. Kjekstad, B. Lyon, and G. Yetman. 2005. Natural Disaster Hotspots: A Global Risk Analysis. Washington, D.C.: World Bank. https://doi.org/10.1596/0-8213-5930-4.
- Center for Hazards and Risk Research - CHRR - Columbia University, Center for International Earth Science Information Network - CIESIN - Columbia University, and International Research Institute for Climate and Society - IRI - Columbia University. 2005. Global Drought Hazard Frequency and Distribution. Palisades, NY: NASA Socioeconomic Data and Applications Center (SEDAC). https://doi.org/10.7927/H4VX0DFT.
- Center for Hazards and Risk Research - CHRR - Columbia University, Center for International Earth Science Information Network - CIESIN - Columbia University. 2005. Global Flood Hazard Frequency and Distribution. Palisades, NY: NASA Socioeconomic Data and Applications Center (SEDAC). https://doi.org/10.7927/H4668B3D.
- Center for Hazards and Risk Research - CHRR - Columbia University, Center for International Earth Science Information Network - CIESIN - Columbia University. 2005. Global Earthquake Hazard Distribution - Peak Ground Acceleration. Palisades, NY: NASA Socioeconomic Data and Applications Center (SEDAC). https://doi.org/10.7927/H4BZ63ZS.
Recent Nearby Earthquakes
Magnitude 3.0 and greater
| Date▼ | Time↕ | Magnitude↕ | Distance↕ | Depth↕ | Location↕ | Link |
|---|---|---|---|---|---|---|
| 11/23/06 | 7:15 AM | 4.8 | 85.4 km | 10,000 m | Hungary | usgs.gov |
| 11/15/06 | 6:09 PM | 3.1 | 82.7 km | 10,000 m | Hungary | usgs.gov |
| 7/14/06 | 11:06 AM | 3 | 63.1 km | 0 m | Romania | usgs.gov |
| 1/4/99 | 12:30 AM | 4.1 | 99.2 km | 33,000 m | Ukraine | usgs.gov |
| 11/1/87 | 9:46 PM | 3.3 | 35.7 km | 91,600 m | Romania | usgs.gov |
| 3/8/79 | 1:20 AM | 4 | 94.3 km | 10,000 m | Romania | usgs.gov |
| 6/30/78 | 1:15 AM | 4.3 | 85.2 km | 10,000 m | Romania | usgs.gov |
| 6/22/78 | 5:31 AM | 3.2 | 91.7 km | 10,000 m | Hungary | usgs.gov |
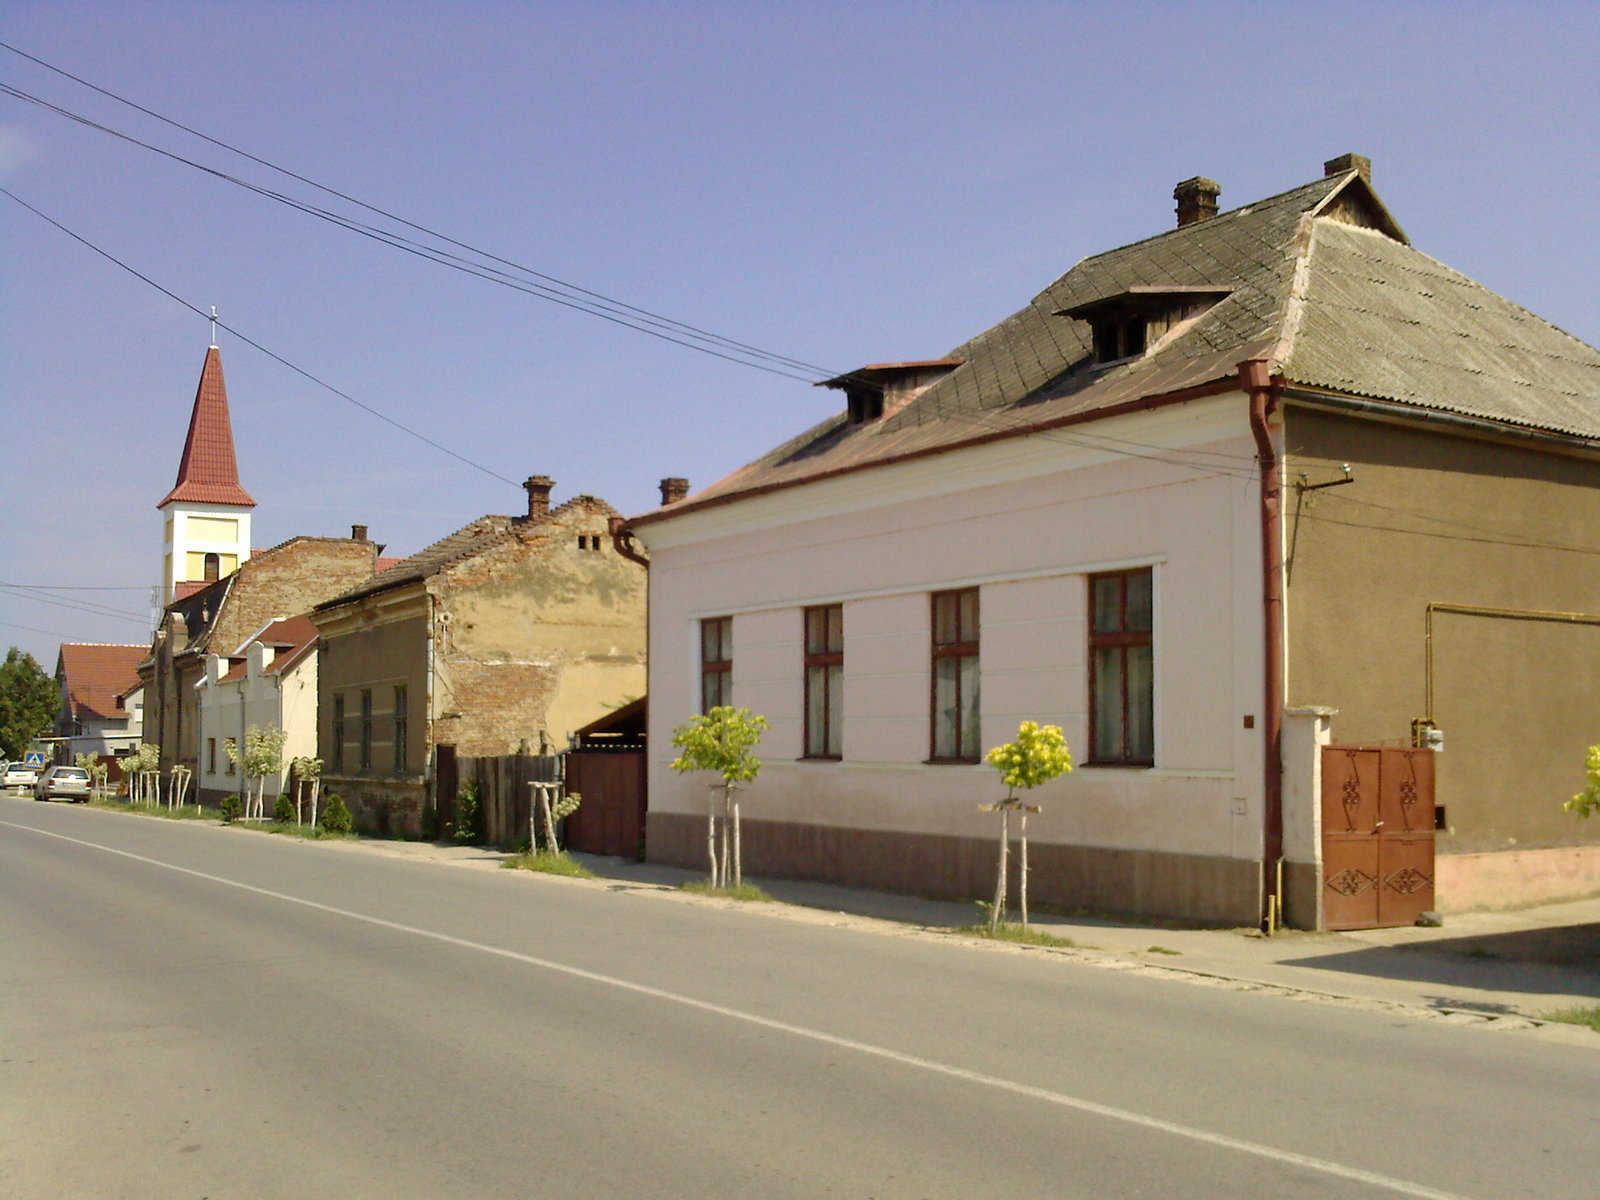
Tarcea
Tarcea (Hungarian: Értarcsa) is a commune located in Bihor County, Romania. It is composed of three villages: Adoni (Éradony), Galoşpetreu (Gálospetri) and Tarcea. At the 2002 census, it had 2706 inhabitants, of whom 77% were Hungarians, 16.8% Romani..
Tarcea Wikipedia Page


About Our Data
The data on this page is estimated using a number of publicly available tools and resources. It is provided without warranty, and could contain inaccuracies. Use at your own risk.