Industries
Business Distribution by Industry in Ștei
| Industry Description | Number of Establishments |
|---|---|
| Education | 16 |
| Restaurants | 14 |
| Real estate | 13 |
| Hospitals | 10 |
| Stadiums and arenas | 10 |
| Shopping | 9 |
| Grocery stores and supermarkets | 8 |
| Cemeteries and crematoriums | 7 |
| Pharmacies and drug stores | 7 |
| Cafes | 6 |
| Churches | 5 |
| Bars, pubs and taverns | 5 |
| Religion | 5 |
Ștei Facts
| Area | 3.1 km² |
| Population | 5,663 |
| Male Population | 2,792 (49.3%) |
| Female Population | 2,871 (50.7%) |
| Population change (1975 to 2020) | -8.5% |
| Population change (2000 to 2020) | -17.8% |
| Median Age | 42.7 years (Male: 41.6, Female: 44.1) |
| GDP per capita (PPP) | $19,804 (2022) |
| Neighborhoods | Centru |
| Local Time | |
| Timezone | Eastern European Summer Time |
| Lat & Lng | 46.53333, 22.45000 |
| Postal Codes | 415600, 417418 |
Map of Ștei
Interactive Map
Ștei Population
Years 1975 to 2030
| Data | 1975 | 1990 | 2000 | 2015 | 2020 | 2025* | 2030* |
|---|---|---|---|---|---|---|---|
| Population | 6,191 | 7,245 | 6,891 | 5,767 | 5,663 | 5,694 | 5,551 |
| Population Density | 2,021.6 / km² | 2,365.7 / km² | 2,250.1 / km² | 1,883.1 / km² | 1,849.1 / km² | 1,859.3 / km² | 1,812.6 / km² |
Ștei Population change from 2000 to 2020
Decrease of 17.8% from year 2000 to 2020
| Location | Change since 1975 | Change since 1990 | Change since 2000 |
|---|---|---|---|
| Ștei | -8.5% | -21.8% | -17.8% |
| Bihor County | — | — | — |
| Romania | — | — | — |
Ștei Median Age
Median Age: 42.7 years
| Location | Median Age | Median Age (Female) | Median Age (Male) |
|---|---|---|---|
| Ștei | 42.7 yrs | 44.1 yrs | 41.6 yrs |
| Bihor County | 39.1 yrs | 40.8 yrs | 37.5 yrs |
| Romania | 40.1 yrs | 41.6 yrs | 38.5 yrs |
Ștei Population Density
Population Density: 1,849 / km²
| Location | Population | Area | Density |
|---|---|---|---|
| Ștei | 5,663 | 3.063 km² | 1,849 / km² |
| Bihor County | 525,688 | 7,546.5 km² | 69.7 / km² |
| Romania | 19.5 million | 238,387.8 km² | 81.8 / km² |
Ștei Historical and Projected Population
Estimated Population from 0 to 2100
- JRC (European Commission's Joint Research Centre) work on the GHS built-up grid
- CIESIN (Center for International Earth Science Information Network)
- [Link] Klein Goldewijk, K., Beusen, A., Doelman, J., and Stehfest, E.: Anthropogenic land use estimates for the Holocene – HYDE 3.2, Earth Syst. Sci. Data, 9, 927–953, https://doi.org/10.5194/essd-9-927-2017, 2017.
Price Distribution
Business distribution by price for Ștei
Human Development Index (HDI)
Statistic composite index of life expectancy, education, and per capita income.
Ștei Gross Domestic Product (GDP)
GDP per capita, PPP (constant 2017 international $)
| Data | 1990 | 1995 | 2000 | 2005 | 2010 | 2015 | 2020 | 2022 |
|---|---|---|---|---|---|---|---|---|
| GDP per capita | $7,070 | $6,881 | $6,464 | $12,071 | $13,657 | $12,368 | $18,135 | $19,804 |
| Total GDP | $82.6M | $79.9M | $75M | $137.5M | $153M | $138.9M | $199.4M | $219.4M |
Ștei CO2 Emissions
Carbon Dioxide (CO2) Emissions Per Capita in Tonnes Per Year
| Location | CO2 Emissions | CO2 Emissions Per Capita | CO2 Emissions Intensity |
|---|---|---|---|
| Ștei | 27,316 tn | 4.82 tn | 8,919.4 tons/km² |
| Bihor County | 2,547,055 tn | 4.85 tn | 337.5 tons/km² |
| Romania | 86,961,323 tn | 4.46 tn | 364.8 tons/km² |
| 2013 CO2 emissions (tonnes/year) | 27,316 tn |
| 2013 CO2 emissions (tonnes/year) per capita | 4.82 tn |
| 2013 CO2 emissions intensity (tonnes/km²/year) | 8,919.4 tons/km² |
Natural Hazards Risk
Relative risk out of 10
| Hazard | Risk Level |
|---|---|
| Drought | Low (2) |
| Flood | High (9) |
| Earthquake | Low (2) |
* Risk, particularly concerning flood or landslide, may not be for the entire area.
- Dilley, M., R.S. Chen, U. Deichmann, A.L. Lerner-Lam, M. Arnold, J. Agwe, P. Buys, O. Kjekstad, B. Lyon, and G. Yetman. 2005. Natural Disaster Hotspots: A Global Risk Analysis. Washington, D.C.: World Bank. https://doi.org/10.1596/0-8213-5930-4.
- Center for Hazards and Risk Research - CHRR - Columbia University, Center for International Earth Science Information Network - CIESIN - Columbia University, and International Research Institute for Climate and Society - IRI - Columbia University. 2005. Global Drought Hazard Frequency and Distribution. Palisades, NY: NASA Socioeconomic Data and Applications Center (SEDAC). https://doi.org/10.7927/H4VX0DFT.
- Center for Hazards and Risk Research - CHRR - Columbia University, Center for International Earth Science Information Network - CIESIN - Columbia University. 2005. Global Flood Hazard Frequency and Distribution. Palisades, NY: NASA Socioeconomic Data and Applications Center (SEDAC). https://doi.org/10.7927/H4668B3D.
- Center for Hazards and Risk Research - CHRR - Columbia University, Center for International Earth Science Information Network - CIESIN - Columbia University. 2005. Global Earthquake Hazard Distribution - Peak Ground Acceleration. Palisades, NY: NASA Socioeconomic Data and Applications Center (SEDAC). https://doi.org/10.7927/H4BZ63ZS.
Recent Nearby Earthquakes
Magnitude 3.0 and greater
| Date▼ | Time↕ | Magnitude↕ | Distance↕ | Depth↕ | Location↕ | Link |
|---|---|---|---|---|---|---|
| 7/14/06 | 11:06 AM | 3 | 40.8 km | 0 m | Romania | usgs.gov |
| 5/17/05 | 2:52 AM | 3.1 | 46.6 km | 33,800 m | Romania | usgs.gov |
| 3/2/92 | 8:33 PM | 4.6 | 90.4 km | 25,600 m | Romania | usgs.gov |
| 12/19/91 | 3:12 AM | 4.3 | 97.3 km | 10,000 m | Romania | usgs.gov |
| 12/18/91 | 10:24 AM | 3.9 | 91.7 km | 10,000 m | Romania | usgs.gov |
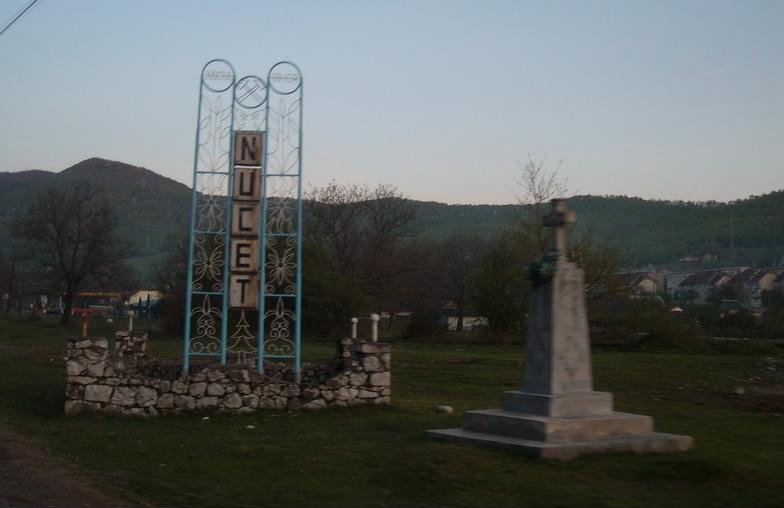
Ștei
Ștei (Hungarian: Vaskohsziklás) is a town in Bihor County, western Transylvania, Romania. Between 1958 and 1996, it was named Dr. Petru Groza, after the Romanian socialist leader who had died in 1958.
Ștei Wikipedia Page


About Our Data
The data on this page is estimated using a number of publicly available tools and resources. It is provided without warranty, and could contain inaccuracies. Use at your own risk.