Kadom Facts
| Area | 7.7 km² |
| Population | 2,480 |
| Male Population | 1,127 (45.5%) |
| Female Population | 1,353 (54.5%) |
| Population change (1975 to 2020) | -49.7% |
| Population change (2000 to 2020) | -32.0% |
| Median Age | 42.1 years (Male: 37.9, Female: 46) |
| Local Time | |
| Timezone | Moscow Standard Time |
| Lat & Lng | 54.55917, 42.46750 |
| Postal Codes | 391670, 391671 |
Map of Kadom
Interactive Map
Kadom Population
Years 1975 to 2020
| Data | 1975 | 1990 | 2000 | 2015 | 2020 |
|---|---|---|---|---|---|
| Population | 4,932 | 4,330 | 3,646 | 2,586 | 2,480 |
| Population Density | 641.6 / km² | 563.3 / km² | 474.3 / km² | 336.4 / km² | 322.6 / km² |
Sources: JRC (European Commission's Joint Research Centre) work on the GHS built-up grid
Kadom Population change from 2000 to 2015
Decrease of 29.1% from year 2000 to 2015
| Location | Change since 1975 | Change since 1990 | Change since 2000 |
|---|---|---|---|
| Kadom | -47.6% | -40.3% | -29.1% |
| Ryazan Oblast | -12.6% | -15.4% | -10.2% |
| Russia | +7.1% | -2.9% | -2% |
Sources: JRC (European Commission's Joint Research Centre) work on the GHS built-up grid
Kadom Median Age
Median Age: 42.1 years
| Location | Median Age | Median Age (Female) | Median Age (Male) |
|---|---|---|---|
| Kadom | 42.1 yrs | 46 yrs | 37.9 yrs |
| Ryazan Oblast | 42.1 yrs | 46 yrs | 37.9 yrs |
| Russia | 38.2 yrs | 41.2 yrs | 35.1 yrs |
Sources: CIESIN (Center for International Earth Science Information Network)
Kadom Population Density
Population Density: 323 / km²
| Location | Population | Area | Density |
|---|---|---|---|
| Kadom | 2,480 | 7.7 km² | 323 / km² |
| Ryazan Oblast | 1.1 million | 39,719.2 km² | 28.3 / km² |
| Russia | 145.3 million | 16,974,452.8 km² | 8.6 / km² |
Sources: JRC (European Commission's Joint Research Centre) work on the GHS built-up grid
Kadom Historical and Projected Population
Estimated Population from 100 to 2100
Sources:
- JRC (European Commission's Joint Research Centre) work on the GHS built-up grid
- CIESIN (Center for International Earth Science Information Network)
- [Link] Klein Goldewijk, K., Beusen, A., Doelman, J., and Stehfest, E.: Anthropogenic land use estimates for the Holocene – HYDE 3.2, Earth Syst. Sci. Data, 9, 927–953, https://doi.org/10.5194/essd-9-927-2017, 2017.
Human Development Index (HDI)
Statistic composite index of life expectancy, education, and per capita income.
Source: [Link] Kummu, M., Taka, M. &Guillaume, J. Gridded global datasets for Gross Domestic Product and Human Development Index over 1990–2015. Sci Data 5, 180004 (2018) doi:10.1038/sdata.2018.4
Kadom CO2 Emissions
Carbon Dioxide (CO2) Emissions Per Capita in Tonnes Per Year
| Location | CO2 Emissions | CO2 Emissions Per Capita | CO2 Emissions Intensity |
|---|---|---|---|
| Kadom | 19,401 tn | 7.82 tn | 2,523.7 tons/km² |
| Ryazan Oblast | 9,129,573 tn | 8.12 tn | 229.9 tons/km² |
| Russia | 1,356,388,647 tn | 9.34 tn | 79.9 tons/km² |
Sources: [Link] Moran, D., Kanemoto K; Jiborn, M., Wood, R., Többen, J., and Seto, K.C. (2018) Carbon footprints of 13,000 cities. Environmental Research Letters DOI: 10.1088/1748-9326/aac72a
Kadom CO2 Emissions
| 2013 CO2 emissions (tonnes/year) | 19,401 tn |
| 2013 CO2 emissions (tonnes/year) per capita | 7.82 tn |
| 2013 CO2 emissions intensity (tonnes/km²/year) | 2,523.7 tons/km² |
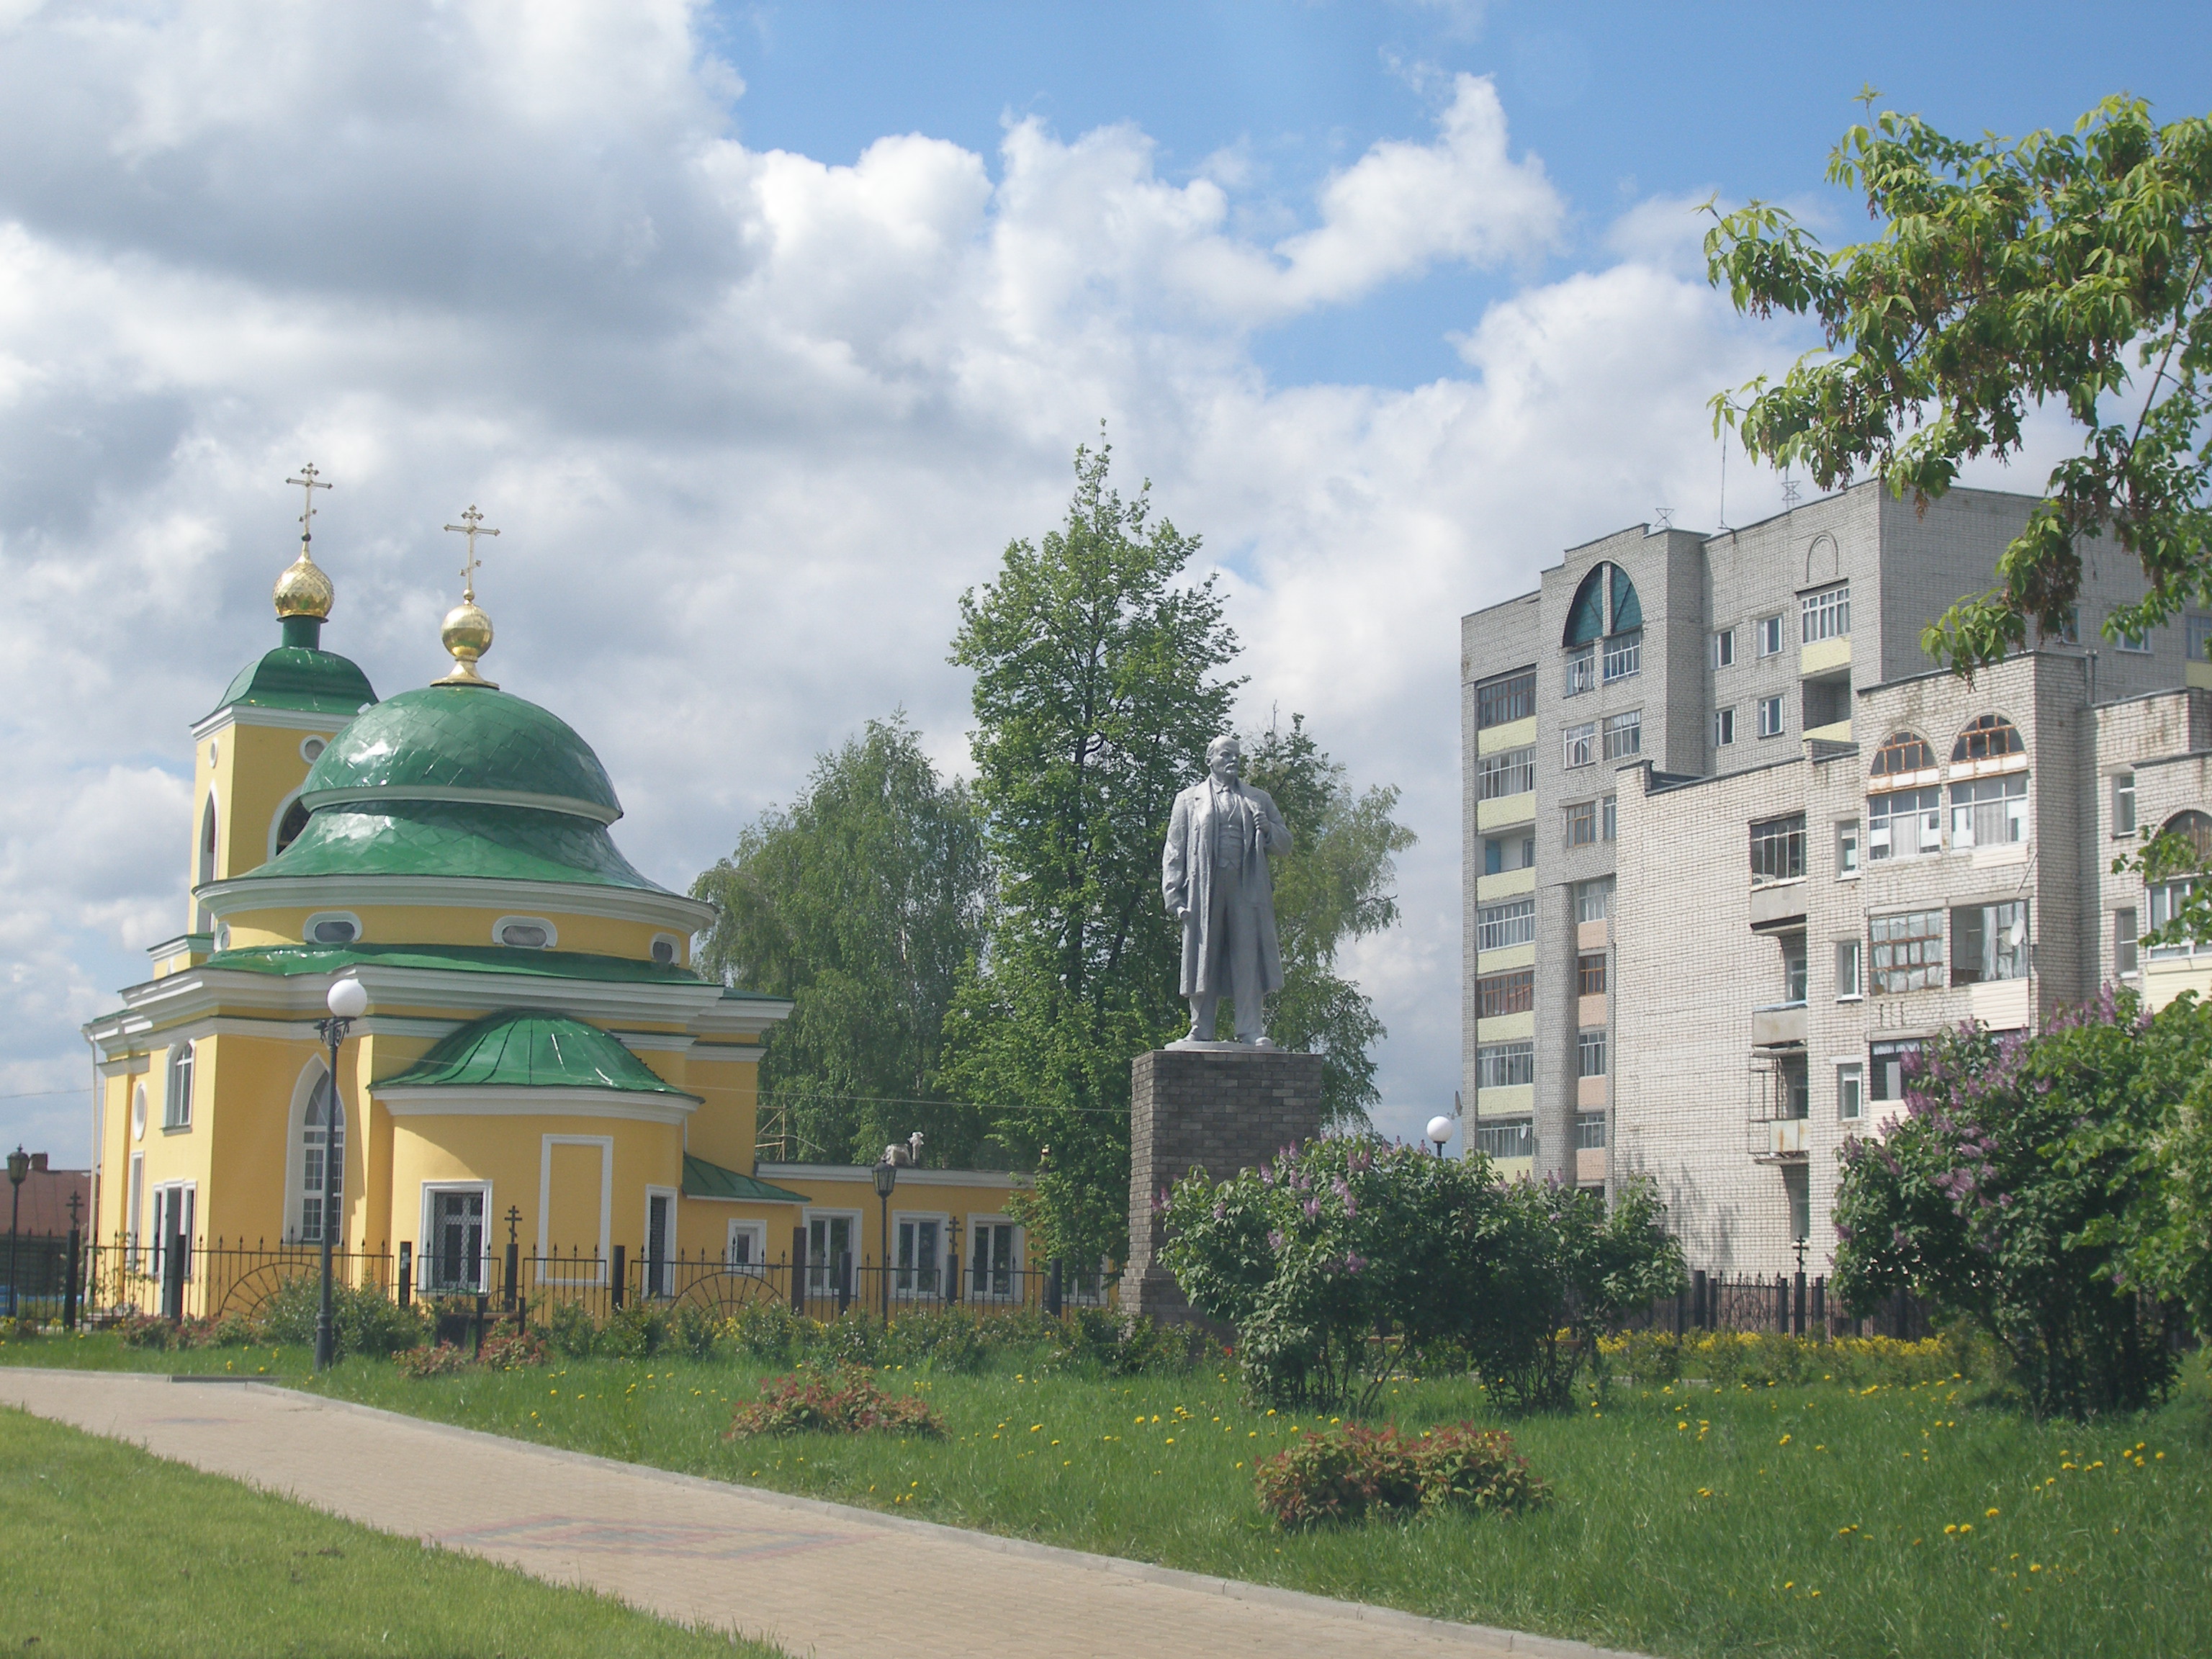
Kadom
(Russian: Кадом) is an urban locality (an urban-type settlement) and the administrative center of Kadomsky District of Ryazan Oblast, Russia, located on the Moksha River 245 kilometers (152 mi) from Ryazan. Population: 5,478 (2010 Census); 6,181 (2..
Kadom Wikipedia Page

About Our Data
The data on this page is estimated using a number of publicly available tools and resources. It is provided without warranty, and could contain inaccuracies. Use at your own risk.