Categories in Ust-Katav
Industries
Business Distribution by Industry in Ust-Katav
| Industry Description | Number of Establishments | Average Google Rating |
|---|---|---|
| Education | 5 | 4.7 |
| Public administration | 5 | 3 |
Ust-Katav Facts
| Area | 11.4 km² |
| Population | 15,378 |
| Male Population | 7,034 (45.7%) |
| Female Population | 8,344 (54.3%) |
| Population change (1975 to 2020) | -11.3% |
| Population change (2000 to 2020) | -8.2% |
| Median Age | 37.9 years (Male: 34.8, Female: 40.9) |
| Local Time | |
| Timezone | Yekaterinburg Standard Time |
| Lat & Lng | 54.93660, 58.17570 |
| Postal Codes | 456040, 456041, 456042, 456043, 456044, More |
Map of Ust-Katav
Interactive Map
Ust-Katav Population
Years 1975 to 2020
| Data | 1975 | 1990 | 2000 | 2015 | 2020 |
|---|---|---|---|---|---|
| Population | 17,330 | 18,300 | 16,747 | 15,130 | 15,378 |
| Population Density | 1,523.5 / km² | 1,608.8 / km² | 1,472.3 / km² | 1,330.1 / km² | 1,351.9 / km² |
Ust-Katav Population change from 2000 to 2015
Decrease of 9.7% from year 2000 to 2015
| Location | Change since 1975 | Change since 1990 | Change since 2000 |
|---|---|---|---|
| Ust-Katav | -12.7% | -17.3% | -9.7% |
| Chelyabinsk Oblast | -0.6% | -8.2% | -5.7% |
| Russia | +7.1% | -2.9% | -2% |
Ust-Katav Median Age
Median Age: 37.9 years
| Location | Median Age | Median Age (Female) | Median Age (Male) |
|---|---|---|---|
| Ust-Katav | 37.9 yrs | 40.9 yrs | 34.8 yrs |
| Chelyabinsk Oblast | 37.9 yrs | 40.9 yrs | 34.8 yrs |
| Russia | 38.2 yrs | 41.2 yrs | 35.1 yrs |
Ust-Katav Population Density
Population Density: 1,352 / km²
| Location | Population | Area | Density |
|---|---|---|---|
| Ust-Katav | 15,378 | 11.4 km² | 1,352 / km² |
| Chelyabinsk Oblast | 3.4 million | 88,679.4 km² | 38.8 / km² |
| Russia | 145.3 million | 16,974,452.8 km² | 8.6 / km² |
Ust-Katav Historical and Projected Population
Estimated Population from 1750 to 2100
- JRC (European Commission's Joint Research Centre) work on the GHS built-up grid
- CIESIN (Center for International Earth Science Information Network)
- [Link] Klein Goldewijk, K., Beusen, A., Doelman, J., and Stehfest, E.: Anthropogenic land use estimates for the Holocene – HYDE 3.2, Earth Syst. Sci. Data, 9, 927–953, https://doi.org/10.5194/essd-9-927-2017, 2017.
Area Codes
Percentage Area Codes used by businesses in Ust-Katav
Postal Codes
Percentage of businesses by Postal Codes in Ust-Katav
Human Development Index (HDI)
Statistic composite index of life expectancy, education, and per capita income.
Ust-Katav CO2 Emissions
Carbon Dioxide (CO2) Emissions Per Capita in Tonnes Per Year
| Location | CO2 Emissions | CO2 Emissions Per Capita | CO2 Emissions Intensity |
|---|---|---|---|
| Ust-Katav | 142,981 tn | 9.3 tn | 12,569.8 tons/km² |
| Chelyabinsk Oblast | 28,962,514 tn | 8.42 tn | 326.6 tons/km² |
| Russia | 1,356,388,647 tn | 9.34 tn | 79.9 tons/km² |
| 2013 CO2 emissions (tonnes/year) | 142,981 tn |
| 2013 CO2 emissions (tonnes/year) per capita | 9.3 tn |
| 2013 CO2 emissions intensity (tonnes/km²/year) | 12,569.8 tons/km² |
Natural Hazards Risk
Relative risk out of 10
| Hazard | Risk Level |
|---|---|
| Drought | High (9) |
* Risk, particularly concerning flood or landslide, may not be for the entire area.
- Dilley, M., R.S. Chen, U. Deichmann, A.L. Lerner-Lam, M. Arnold, J. Agwe, P. Buys, O. Kjekstad, B. Lyon, and G. Yetman. 2005. Natural Disaster Hotspots: A Global Risk Analysis. Washington, D.C.: World Bank. https://doi.org/10.1596/0-8213-5930-4.
- Center for Hazards and Risk Research - CHRR - Columbia University, Center for International Earth Science Information Network - CIESIN - Columbia University, and International Research Institute for Climate and Society - IRI - Columbia University. 2005. Global Drought Hazard Frequency and Distribution. Palisades, NY: NASA Socioeconomic Data and Applications Center (SEDAC). https://doi.org/10.7927/H4VX0DFT.
Recent Nearby Earthquakes
Magnitude 3.0 and greater
| Date▼ | Time↕ | Magnitude↕ | Distance↕ | Depth↕ | Location↕ | Link |
|---|---|---|---|---|---|---|
| 11/15/18 | 7:48 AM | 4.4 | 17.2 km | 10,000 m | 11km WNW of Katav-Ivanovsk, Russia | usgs.gov |
| 9/29/18 | 9:06 AM | 4.4 | 23.4 km | 10,000 m | 11km W of Katav-Ivanovsk, Russia | usgs.gov |
| 9/5/18 | 7:27 AM | 4.2 | 29 km | 10,000 m | 13km WSW of Katav-Ivanovsk, Russia | usgs.gov |
| 9/4/18 | 10:58 PM | 5 | 19.2 km | 10,000 m | 15km WNW of Katav-Ivanovsk, Russia | usgs.gov |
| 5/28/90 | 2:41 AM | 4.5 | 45.3 km | 33,000 m | Ural Mountains region, Russia | usgs.gov |
| 5/28/90 | 12:35 AM | 4.5 | 48.9 km | 33,000 m | Ural Mountains region, Russia | usgs.gov |
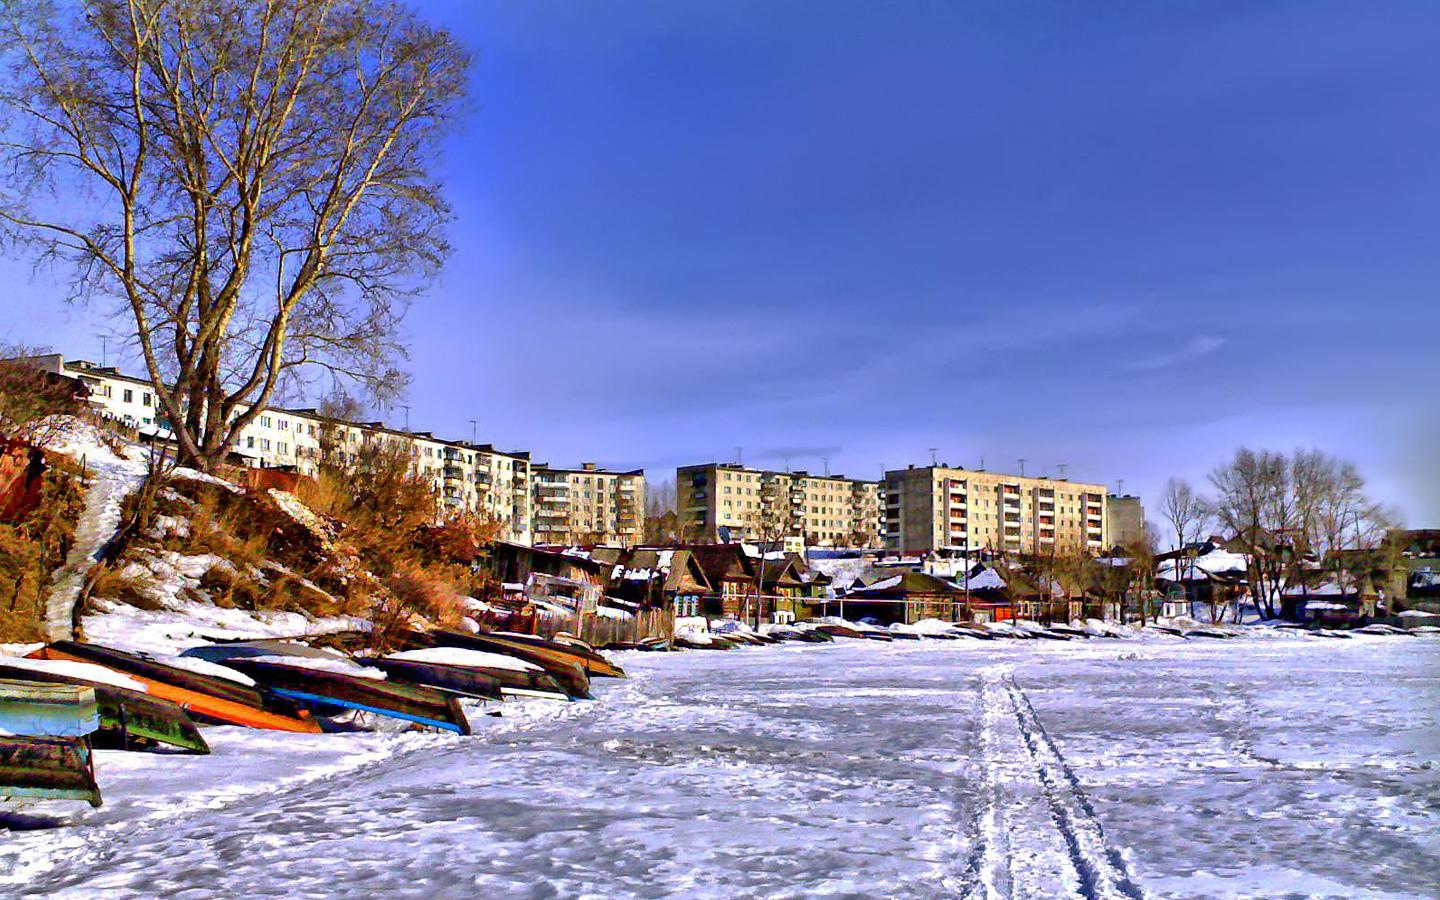
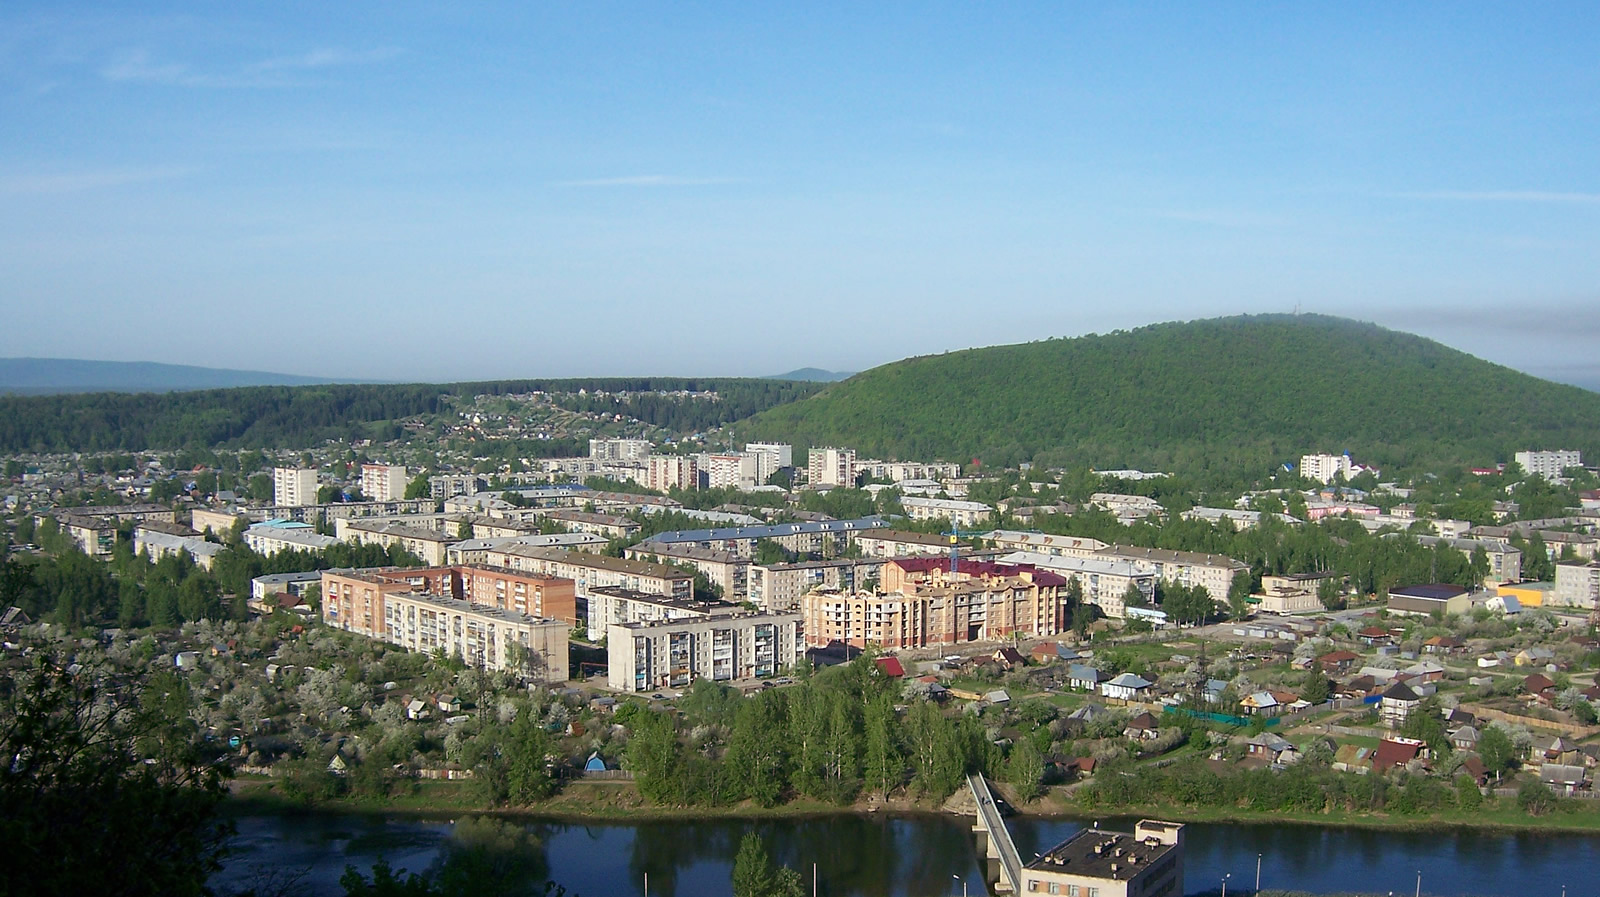
Ust-Katav
Ust-Katav (Russian: Усть-Катав) is a town in Chelyabinsk Oblast, Russia, located on the Yuryuzan River. Population: 23,580 (2010 Census); 25,898 (2002 Census); 31,218 (1989 Census).
Ust-Katav Wikipedia Page
About Our Data
The data on this page is estimated using a number of publicly available tools and resources. It is provided without warranty, and could contain inaccuracies. Use at your own risk.