Categories in Allerum
Car Repair and MaintenanceGeneral Food ManufacturingIndustrial & Construction ManufacturingAssociation or OrganizationBuilding Construction ContractorContractorGround Work ContractorAll food and beverageRestaurantsGardening ServiceBeauty & Skin CareBusiness Management ConsultantConsulting & Advisory ServicesDepartment storesShopping other
Industries
Business Distribution by Industry in Allerum
| Industry Description | Number of Establishments | Average Age of Business |
|---|---|---|
| Shopping other | 15 | 25 years |
| Farming | 12 | 28 years |
| Wholesale of machinery | 11 | 36 years |
| Construction of buildings | 11 | 26 years |
| Other membership organizations | 7 | 28 years |
| Beauty salons | 6 | — |
| Shopping | 6 | — |
| Nurseries and garden supplies | 5 | — |
| Restaurants | 5 | — |
Allerum Facts
| Area | 0.8 km² |
| Population | 326 |
| Male Population | 160 (49.1%) |
| Female Population | 166 (50.9%) |
| Population change (1975 to 2020) | +14.0% |
| Population change (2000 to 2020) | +8.7% |
| Median Age | 40.5 years (Male: 39.2, Female: 41.7) |
| Local Time | |
| Timezone | Central European Summer Time |
| Lat & Lng | 56.11667, 12.68333 |
Map of Allerum
Interactive Map
Allerum Population
Years 1975 to 2020
| Data | 1975 | 1990 | 2000 | 2015 | 2020 |
|---|---|---|---|---|---|
| Population | 286 | 283 | 300 | 311 | 326 |
| Population Density | 381.3 / km² | 377.3 / km² | 400 / km² | 414.7 / km² | 434.7 / km² |
Sources: JRC (European Commission's Joint Research Centre) work on the GHS built-up grid
Allerum Population change from 2000 to 2015
Increase of 3.7% from year 2000 to 2015
| Location | Change since 1975 | Change since 1990 | Change since 2000 |
|---|---|---|---|
| Allerum | +8.7% | +9.9% | +3.7% |
| Skåne County | +44% | +27.7% | +17.6% |
| Sweden | +19.2% | +14.2% | +10.2% |
Sources: JRC (European Commission's Joint Research Centre) work on the GHS built-up grid
Allerum Median Age
Median Age: 40.5 years
| Location | Median Age | Median Age (Female) | Median Age (Male) |
|---|---|---|---|
| Allerum | 40.5 yrs | 41.7 yrs | 39.2 yrs |
| Skåne County | 40.2 yrs | 41.2 yrs | 39.2 yrs |
| Sweden | 40.8 yrs | 41.8 yrs | 39.8 yrs |
Sources: CIESIN (Center for International Earth Science Information Network)
Allerum Population Density
Population Density: 435 / km²
| Location | Population | Area | Density |
|---|---|---|---|
| Allerum | 326 | 0.75 km² | 435 / km² |
| Skåne County | 1.3 million | 17,121.6 km² | 77 / km² |
| Sweden | 9.6 million | 449,151.6 km² | 21.3 / km² |
Sources: JRC (European Commission's Joint Research Centre) work on the GHS built-up grid
Allerum Historical and Projected Population
Estimated Population from 0 to 2100
Sources:
- JRC (European Commission's Joint Research Centre) work on the GHS built-up grid
- CIESIN (Center for International Earth Science Information Network)
- [Link] Klein Goldewijk, K., Beusen, A., Doelman, J., and Stehfest, E.: Anthropogenic land use estimates for the Holocene – HYDE 3.2, Earth Syst. Sci. Data, 9, 927–953, https://doi.org/10.5194/essd-9-927-2017, 2017.
Price Distribution
Business distribution by price for Allerum
Human Development Index (HDI)
Statistic composite index of life expectancy, education, and per capita income.
Source: [Link] Kummu, M., Taka, M. &Guillaume, J. Gridded global datasets for Gross Domestic Product and Human Development Index over 1990–2015. Sci Data 5, 180004 (2018) doi:10.1038/sdata.2018.4
Allerum CO2 Emissions
Carbon Dioxide (CO2) Emissions Per Capita in Tonnes Per Year
| Location | CO2 Emissions | CO2 Emissions Per Capita | CO2 Emissions Intensity |
|---|---|---|---|
| Allerum | 3,206 tn | 9.83 tn | 4,274.2 tons/km² |
| Skåne County | 8,478,344 tn | 6.43 tn | 495.2 tons/km² |
| Sweden | 93,354,240 tn | 9.75 tn | 207.8 tons/km² |
Sources: [Link] Moran, D., Kanemoto K; Jiborn, M., Wood, R., Többen, J., and Seto, K.C. (2018) Carbon footprints of 13,000 cities. Environmental Research Letters DOI: 10.1088/1748-9326/aac72a
Allerum CO2 Emissions
| 2013 CO2 emissions (tonnes/year) | 3,206 tn |
| 2013 CO2 emissions (tonnes/year) per capita | 9.83 tn |
| 2013 CO2 emissions intensity (tonnes/km²/year) | 4,274.2 tons/km² |
Recent Nearby Earthquakes
Magnitude 3.0 and greater
| Date▼ | Time↕ | Magnitude↕ | Distance↕ | Depth↕ | Location↕ | Link |
|---|---|---|---|---|---|---|
| 8/6/12 | 2:57 AM | 4.2 | 67.1 km | 9,800 m | Sweden | usgs.gov |
| 12/16/08 | 5:20 AM | 4.3 | 81.1 km | 10,000 m | Sweden | usgs.gov |
| 2/3/05 | 5:49 PM | 3 | 76.2 km | 0 m | Denmark | usgs.gov |
| 2/3/05 | 3:49 PM | 3 | 92.3 km | 100 m | Denmark | usgs.gov |
| 10/4/95 | 8:49 PM | 3.9 | 68.3 km | 10,000 m | Sweden | usgs.gov |
| 4/1/86 | 9:56 AM | 4.2 | 49.6 km | 33,000 m | Sweden | usgs.gov |
| 6/15/85 | 12:40 AM | 4.4 | 55.2 km | 33,000 m | Sweden | usgs.gov |
Source: U.S. Geological Survey (USGS)
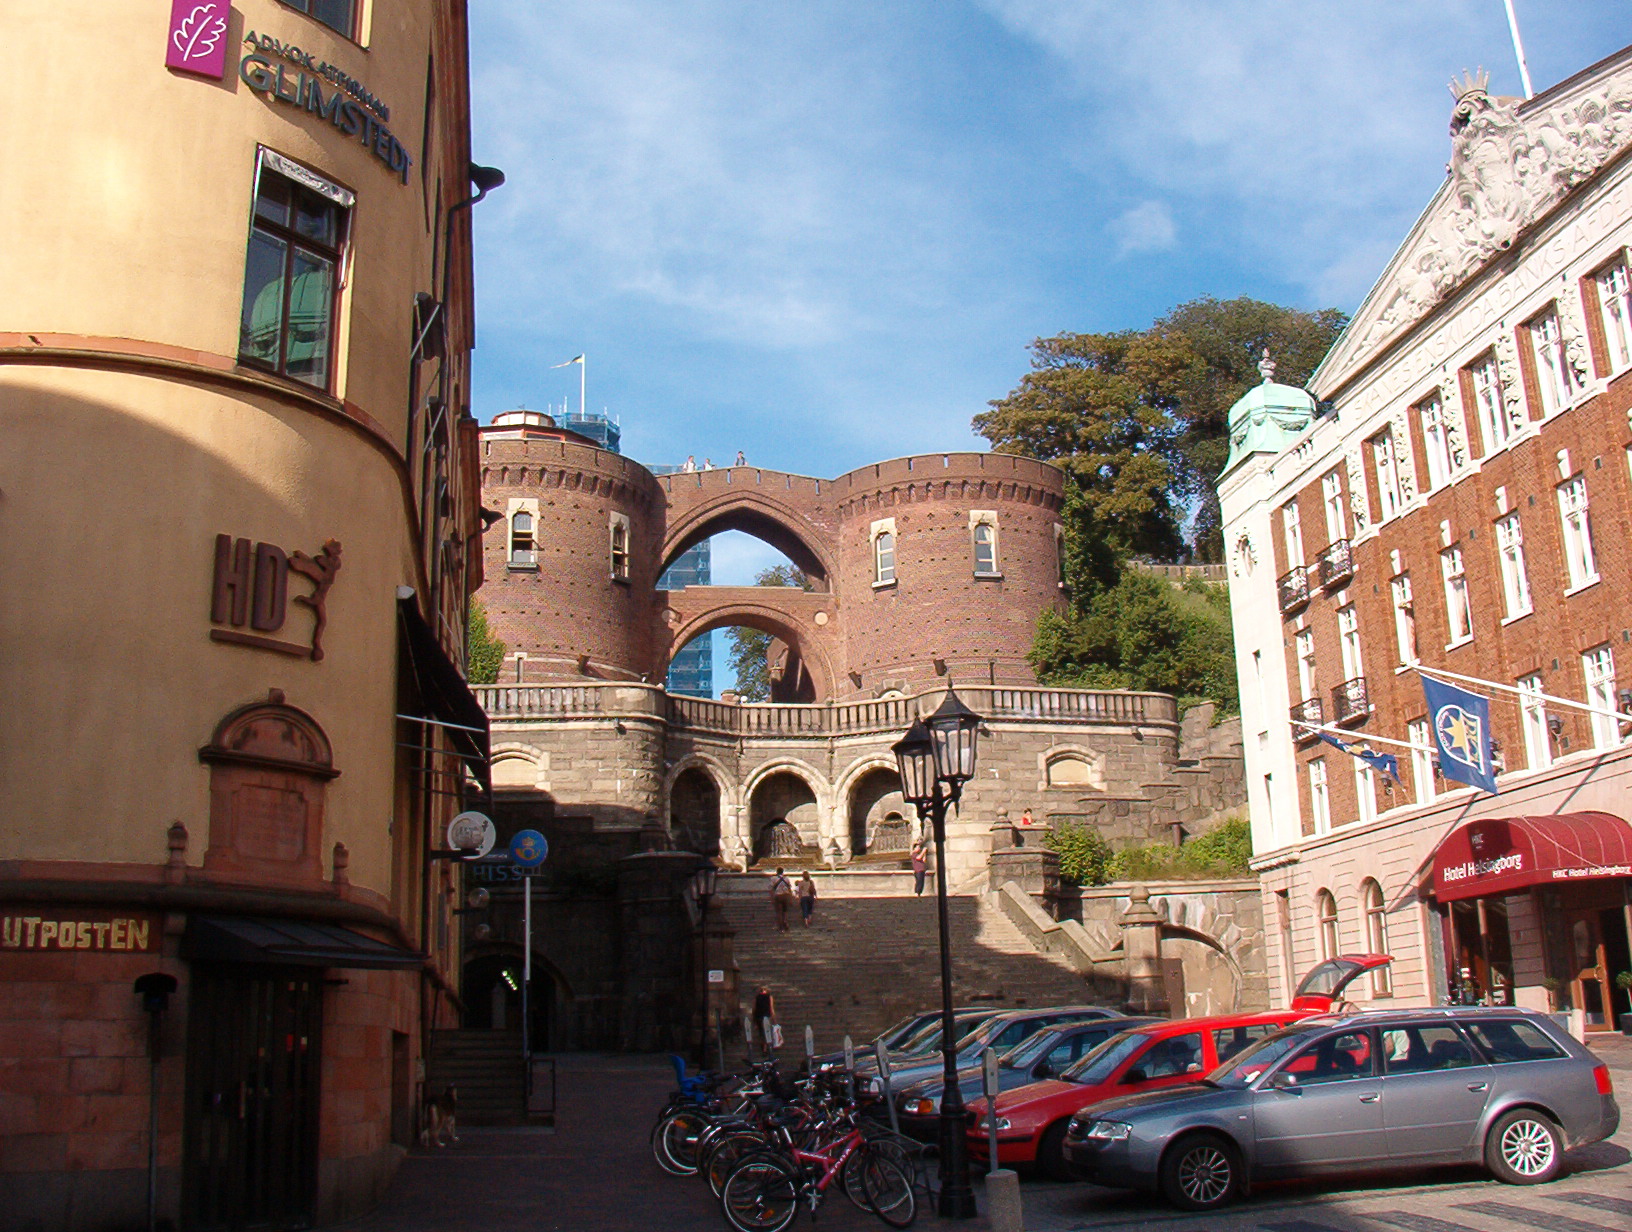
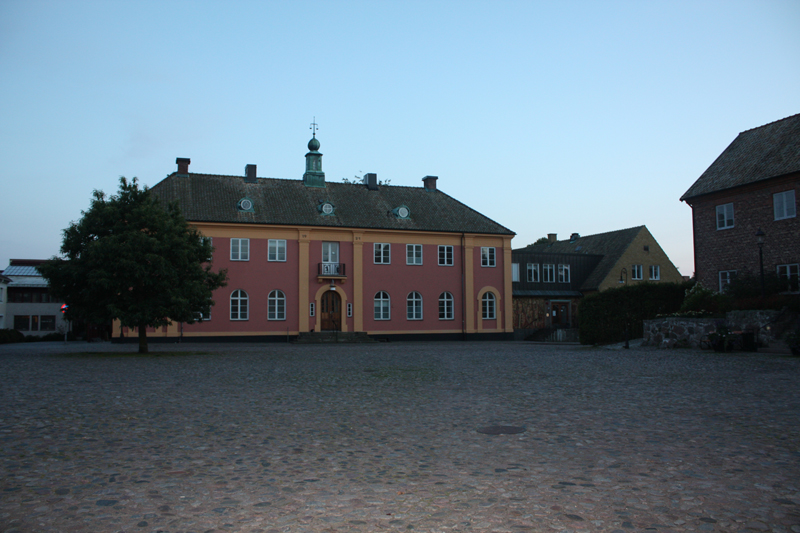
Allerum
Allerum is a locality situated in Helsingborg Municipality, Skåne County, Sweden with 716 inhabitants in 2010.
Allerum Wikipedia Page

About Our Data
The data on this page is estimated using a number of publicly available tools and resources. It is provided without warranty, and could contain inaccuracies. Use at your own risk.