Industries
Business Distribution by Industry in Dalstorp
| Industry Description | Number of Establishments | Average Age of Business |
|---|---|---|
| Wholesale of machinery | 12 | 26 years |
| Shopping other | 12 | 34 years |
| Unreachable | 11 | 29 years |
| Farming | 9 | 24 years |
| Hardware store | 6 | — |
| Shopping | 6 | — |
Map of Dalstorp
Interactive Map
Dalstorp Population
Years 1975 to 2030
| Data | 1975 | 1990 | 2000 | 2015 | 2020 | 2025* | 2030* |
|---|---|---|---|---|---|---|---|
| Population | 1,113 | 755 | 619 | 537 | 700 | 600 | 614 |
| Population Density | 494.7 / km² | 335.6 / km² | 275.1 / km² | 238.7 / km² | 311.1 / km² | 266.7 / km² | 272.9 / km² |
* Projected
Sources: JRC (European Commission's Joint Research Centre) work on the GHS built-up gridDalstorp Population change from 2000 to 2020
Increase of 13.1% from year 2000 to 2020
| Location | Change since 1975 | Change since 1990 | Change since 2000 |
|---|---|---|---|
| Dalstorp | -37.1% | -7.3% | +13.1% |
| Västra Götaland County | — | — | — |
| Sweden | — | — | — |
Sources: JRC (European Commission's Joint Research Centre) work on the GHS built-up grid
Dalstorp Population Density
Population Density: 311 / km²
| Location | Population | Area | Density |
|---|---|---|---|
| Dalstorp | 700 | 2.25 km² | 311 / km² |
| Västra Götaland County | 1.6 million | 34,528 km² | 47.1 / km² |
| Sweden | 9.6 million | 449,151.6 km² | 21.3 / km² |
Sources: JRC (European Commission's Joint Research Centre) work on the GHS built-up grid
Dalstorp Historical and Projected Population
Estimated Population from 0 to 2100
Sources:
- JRC (European Commission's Joint Research Centre) work on the GHS built-up grid
- CIESIN (Center for International Earth Science Information Network)
- [Link] Klein Goldewijk, K., Beusen, A., Doelman, J., and Stehfest, E.: Anthropogenic land use estimates for the Holocene – HYDE 3.2, Earth Syst. Sci. Data, 9, 927–953, https://doi.org/10.5194/essd-9-927-2017, 2017.
Area Codes
Percentage Area Codes used by businesses in Dalstorp
Postal Codes
Percentage of businesses by Postal Codes in Dalstorp
Human Development Index (HDI)
Statistic composite index of life expectancy, education, and per capita income.
Source: [Link] Kummu, M., Taka, M. &Guillaume, J. Gridded global datasets for Gross Domestic Product and Human Development Index over 1990–2015. Sci Data 5, 180004 (2018) doi:10.1038/sdata.2018.4
Dalstorp CO2 Emissions
Carbon Dioxide (CO2) Emissions Per Capita in Tonnes Per Year
| Location | CO2 Emissions | CO2 Emissions Per Capita | CO2 Emissions Intensity |
|---|---|---|---|
| Dalstorp | 7,041 tn | 10.06 tn | 3,129.2 tons/km² |
| Västra Götaland County | 13,696,504 tn | 8.41 tn | 396.7 tons/km² |
| Sweden | 93,354,240 tn | 9.75 tn | 207.8 tons/km² |
Sources: [Link] Moran, D., Kanemoto K; Jiborn, M., Wood, R., Többen, J., and Seto, K.C. (2018) Carbon footprints of 13,000 cities. Environmental Research Letters DOI: 10.1088/1748-9326/aac72a
Dalstorp CO2 Emissions
| 2013 CO2 emissions (tonnes/year) | 7,041 tn |
| 2013 CO2 emissions (tonnes/year) per capita | 10.06 tn |
| 2013 CO2 emissions intensity (tonnes/km²/year) | 3,129.2 tons/km² |
Recent Nearby Earthquakes
Magnitude 3.0 and greater
| Date▼ | Time↕ | Magnitude↕ | Distance↕ | Depth↕ | Location↕ | Link |
|---|---|---|---|---|---|---|
| 7/29/15 | 7:46 PM | 3.4 | 97.4 km | 13,380 m | 7km WSW of Surte, Sweden | usgs.gov |
| 7/14/86 | 2:45 PM | 3.4 | 77.4 km | 10,000 m | Sweden | usgs.gov |
| 7/14/86 | 1:50 PM | 4.8 | 85.4 km | 10,000 m | Sweden | usgs.gov |
Source: U.S. Geological Survey (USGS)
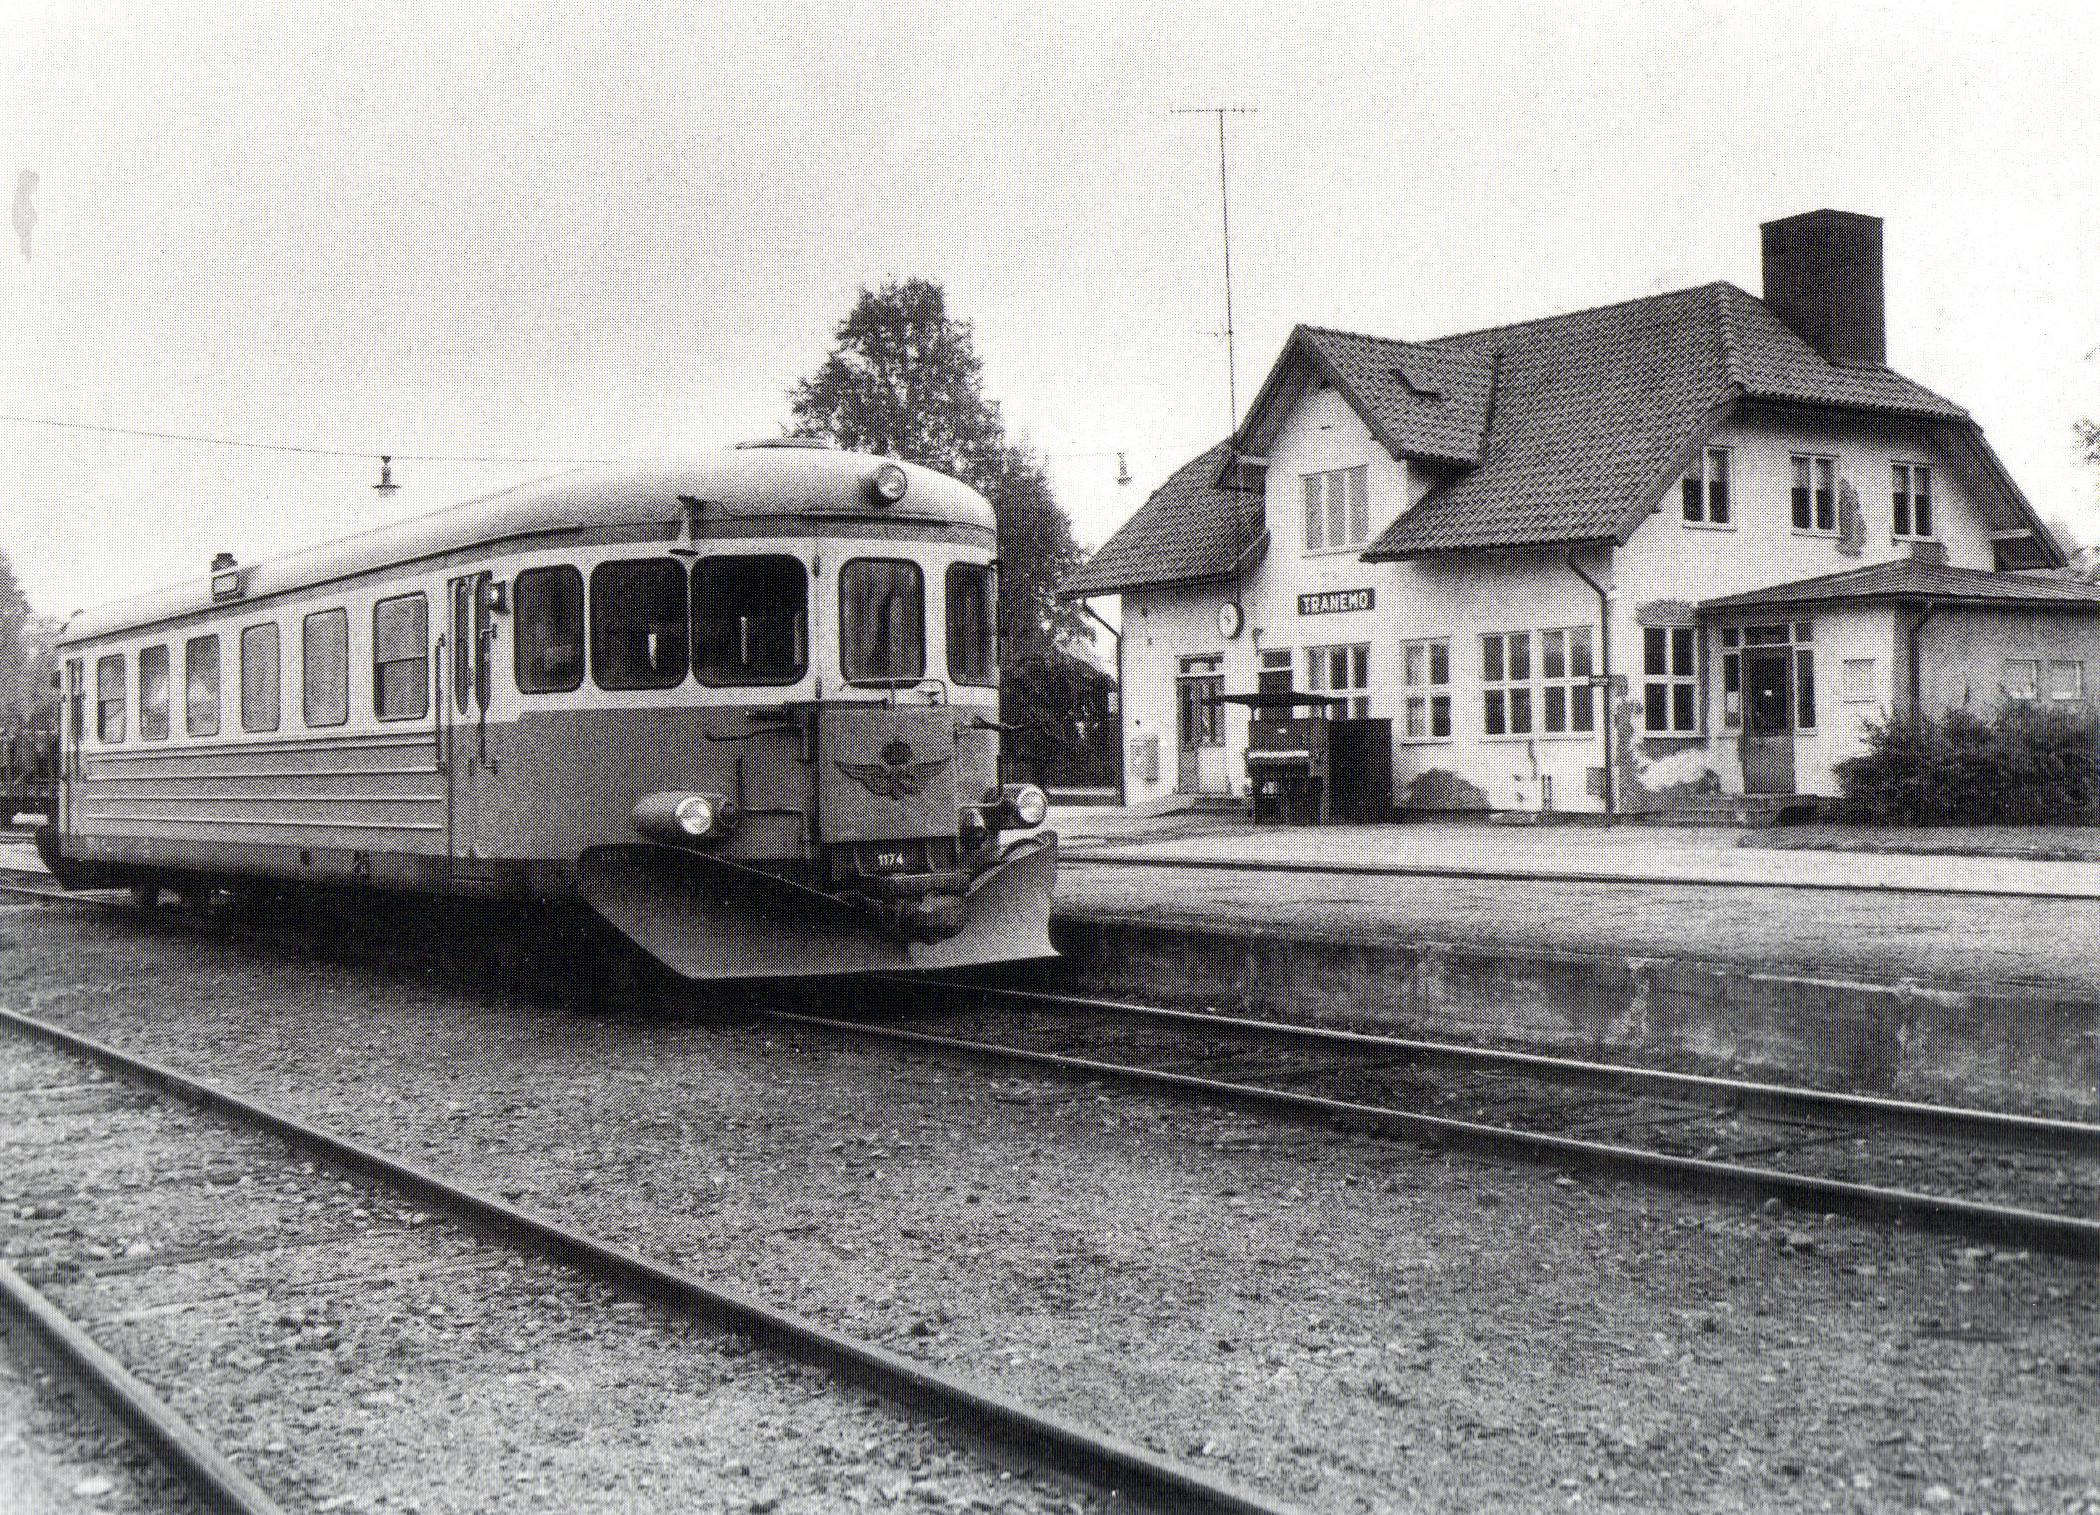
Dalstorp
Dalstorp is a locality situated in Tranemo Municipality, Västra Götaland County, Sweden with 776 inhabitants in 2010.
Dalstorp Wikipedia Page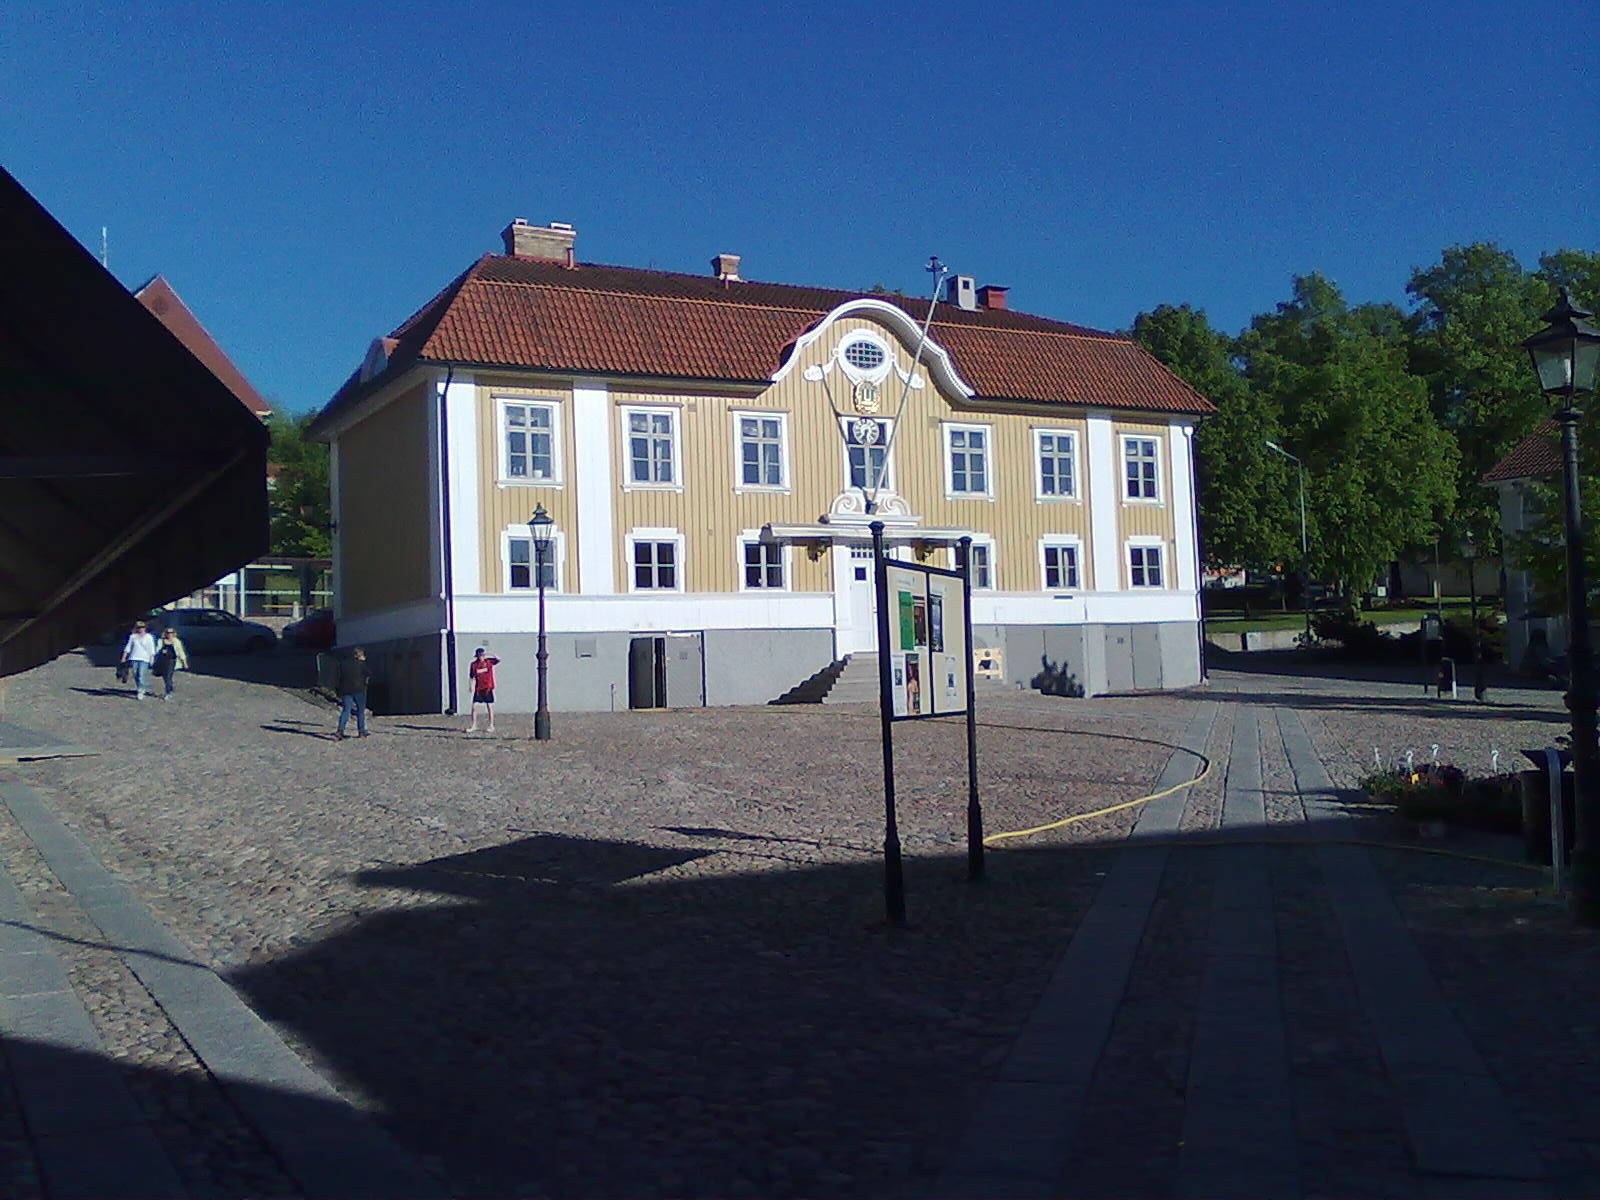
About Our Data
The data on this page is estimated using a number of publicly available tools and resources. It is provided without warranty, and could contain inaccuracies. Use at your own risk.