Categories in Edsbruk
Industries
Business Distribution by Industry in Edsbruk
| Industry Description | Number of Establishments | Average Age of Business | Average Google Rating |
|---|---|---|---|
| All food and beverage | 7 | 28 years | 4.7 |
| Shopping other | 6 | 28 years | 4.7 |
Edsbruk Facts
| Area | 1.4 km² |
| Population | 105 |
| Population change (1975 to 2020) | -49.8% |
| Population change (2000 to 2020) | -15.3% |
| Local Time | |
| Timezone | Central European Summer Time |
| Lat & Lng | 58.03333, 16.46667 |
| Postal Codes | 590 98 |
Map of Edsbruk
Interactive Map
Edsbruk Population
Years 1975 to 2020
| Data | 1975 | 1990 | 2000 | 2015 | 2020 |
|---|---|---|---|---|---|
| Population | 209 | 159 | 124 | 103 | 105 |
| Population Density | 145.4 / km² | 110.6 / km² | 86.3 / km² | 71.7 / km² | 73 / km² |
Edsbruk Population change from 2000 to 2015
Decrease of 16.9% from year 2000 to 2015
| Location | Change since 1975 | Change since 1990 | Change since 2000 |
|---|---|---|---|
| Edsbruk | -50.7% | -35.2% | -16.9% |
| Kalmar County | -12.8% | -6.8% | -2.7% |
| Sweden | +19.2% | +14.2% | +10.2% |
Edsbruk Population Density
Population Density: 73 / km²
| Location | Population | Area | Density |
|---|---|---|---|
| Edsbruk | 105 | 1.438 km² | 73 / km² |
| Kalmar County | 232,725 | 20,601.7 km² | 11.3 / km² |
| Sweden | 9.6 million | 449,151.6 km² | 21.3 / km² |
Edsbruk Historical and Projected Population
Estimated Population from 0 to 2100
- JRC (European Commission's Joint Research Centre) work on the GHS built-up grid
- CIESIN (Center for International Earth Science Information Network)
- [Link] Klein Goldewijk, K., Beusen, A., Doelman, J., and Stehfest, E.: Anthropogenic land use estimates for the Holocene – HYDE 3.2, Earth Syst. Sci. Data, 9, 927–953, https://doi.org/10.5194/essd-9-927-2017, 2017.
Area Codes
Percentage Area Codes used by businesses in Edsbruk
Price Distribution
Business distribution by price for Edsbruk
Human Development Index (HDI)
Statistic composite index of life expectancy, education, and per capita income.
Edsbruk CO2 Emissions
Carbon Dioxide (CO2) Emissions Per Capita in Tonnes Per Year
| Location | CO2 Emissions | CO2 Emissions Per Capita | CO2 Emissions Intensity |
|---|---|---|---|
| Edsbruk | 1,028 tn | 9.79 tn | 715.4 tons/km² |
| Kalmar County | 1,268,099 tn | 5.45 tn | 61.6 tons/km² |
| Sweden | 93,354,240 tn | 9.75 tn | 207.8 tons/km² |
| 2013 CO2 emissions (tonnes/year) | 1,028 tn |
| 2013 CO2 emissions (tonnes/year) per capita | 9.79 tn |
| 2013 CO2 emissions intensity (tonnes/km²/year) | 715.4 tons/km² |
Recent Nearby Earthquakes
Magnitude 3.0 and greater
| Date▼ | Time↕ | Magnitude↕ | Distance↕ | Depth↕ | Location↕ | Link |
|---|---|---|---|---|---|---|
| 9/29/04 | 11:15 PM | 3.7 | 56.8 km | 10,000 m | Baltic Sea | usgs.gov |
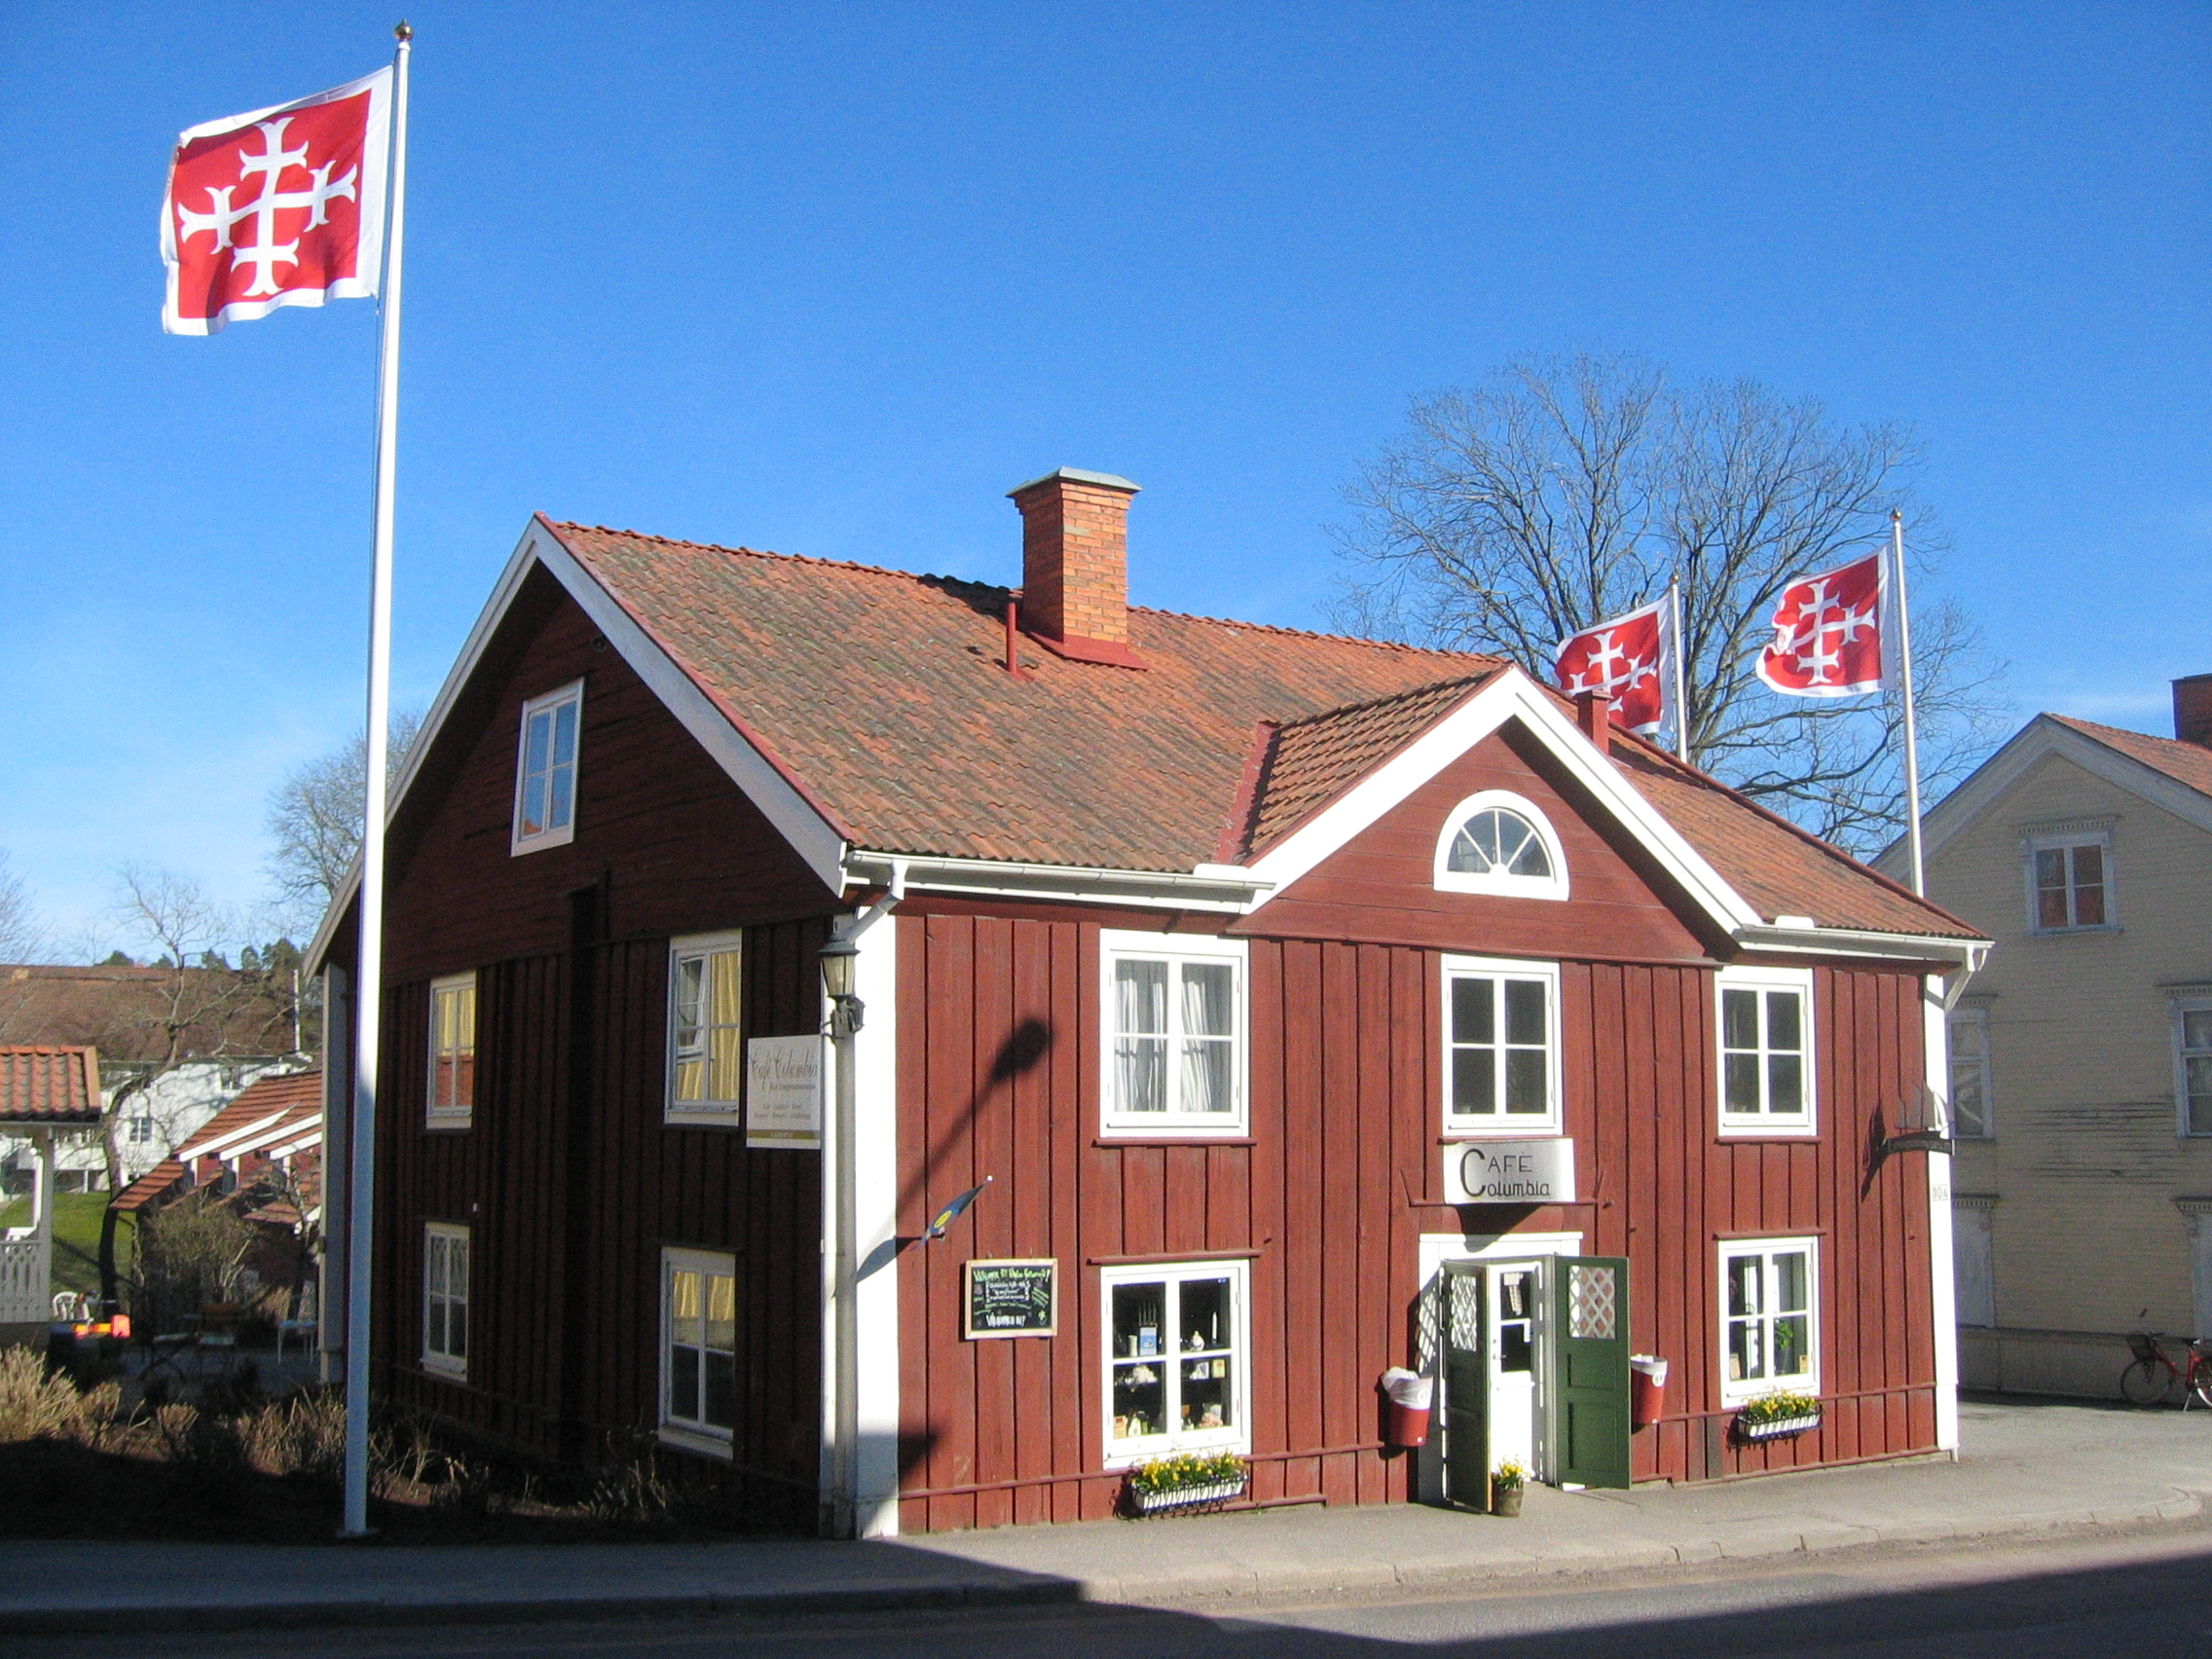
Edsbruk
Edsbruk is a locality situated in Västervik Municipality, Kalmar County, Sweden with 300 inhabitants in 2010. community was originally named Ed. In 1670 Abraham Parment established an ironworks there, Eds Bruk, which employed a large number of the i..
Edsbruk Wikipedia Page

About Our Data
The data on this page is estimated using a number of publicly available tools and resources. It is provided without warranty, and could contain inaccuracies. Use at your own risk.