Fåker Facts
| Area | 0.6 km² |
| Population | 132 |
| Population change (1975 to 2020) | -39.2% |
| Population change (2000 to 2020) | -2.2% |
| Neighborhoods | Åsan, Fåker, Grönviken, Månsta, Nedre Måläng |
| Local Time | |
| Timezone | Central European Summer Time |
| Lat & Lng | 62.98333, 14.58333 |
| Postal Codes | 830 22 |
Map of Fåker
Interactive Map
Fåker Population
Years 1975 to 2020
| Data | 1975 | 1990 | 2000 | 2015 | 2020 |
|---|---|---|---|---|---|
| Population | 217 | 157 | 135 | 129 | 132 |
| Population Density | 385.8 / km² | 279.1 / km² | 240 / km² | 229.3 / km² | 234.7 / km² |
Sources: JRC (European Commission's Joint Research Centre) work on the GHS built-up grid
Fåker Population change from 2000 to 2015
Decrease of 4.4% from year 2000 to 2015
| Location | Change since 1975 | Change since 1990 | Change since 2000 |
|---|---|---|---|
| Fåker | -40.6% | -17.8% | -4.4% |
| Jämtland County | -14.8% | -7.8% | -3.3% |
| Sweden | +19.2% | +14.2% | +10.2% |
Sources: JRC (European Commission's Joint Research Centre) work on the GHS built-up grid
Fåker Population Density
Population Density: 235 / km²
| Location | Population | Area | Density |
|---|---|---|---|
| Fåker | 132 | 0.563 km² | 235 / km² |
| Jämtland County | 125,863 | 54,086 km² | 2.3 / km² |
| Sweden | 9.6 million | 449,151.6 km² | 21.3 / km² |
Sources: JRC (European Commission's Joint Research Centre) work on the GHS built-up grid
Fåker Historical and Projected Population
Estimated Population from 0 to 2100
Sources:
- JRC (European Commission's Joint Research Centre) work on the GHS built-up grid
- CIESIN (Center for International Earth Science Information Network)
- [Link] Klein Goldewijk, K., Beusen, A., Doelman, J., and Stehfest, E.: Anthropogenic land use estimates for the Holocene – HYDE 3.2, Earth Syst. Sci. Data, 9, 927–953, https://doi.org/10.5194/essd-9-927-2017, 2017.
Area Codes
Percentage Area Codes used by businesses in Fåker
Human Development Index (HDI)
Statistic composite index of life expectancy, education, and per capita income.
Source: [Link] Kummu, M., Taka, M. &Guillaume, J. Gridded global datasets for Gross Domestic Product and Human Development Index over 1990–2015. Sci Data 5, 180004 (2018) doi:10.1038/sdata.2018.4
Fåker CO2 Emissions
Carbon Dioxide (CO2) Emissions Per Capita in Tonnes Per Year
| Location | CO2 Emissions | CO2 Emissions Per Capita | CO2 Emissions Intensity |
|---|---|---|---|
| Fåker | 1,257 tn | 9.52 tn | 2,235 tons/km² |
| Jämtland County | 1,200,468 tn | 9.54 tn | 22.2 tons/km² |
| Sweden | 93,354,240 tn | 9.75 tn | 207.8 tons/km² |
Sources: [Link] Moran, D., Kanemoto K; Jiborn, M., Wood, R., Többen, J., and Seto, K.C. (2018) Carbon footprints of 13,000 cities. Environmental Research Letters DOI: 10.1088/1748-9326/aac72a
Fåker CO2 Emissions
| 2013 CO2 emissions (tonnes/year) | 1,257 tn |
| 2013 CO2 emissions (tonnes/year) per capita | 9.52 tn |
| 2013 CO2 emissions intensity (tonnes/km²/year) | 2,235 tons/km² |
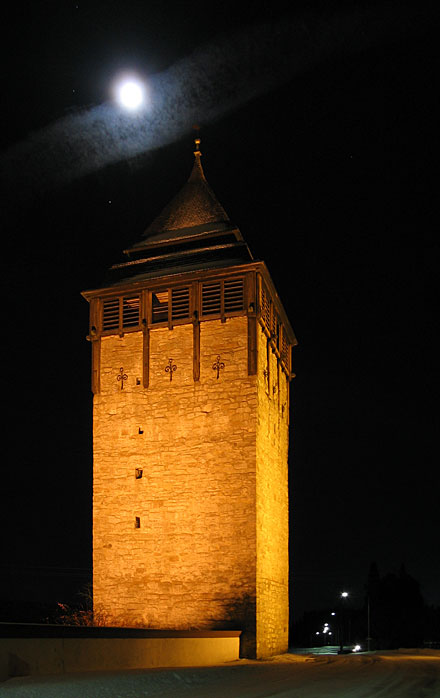
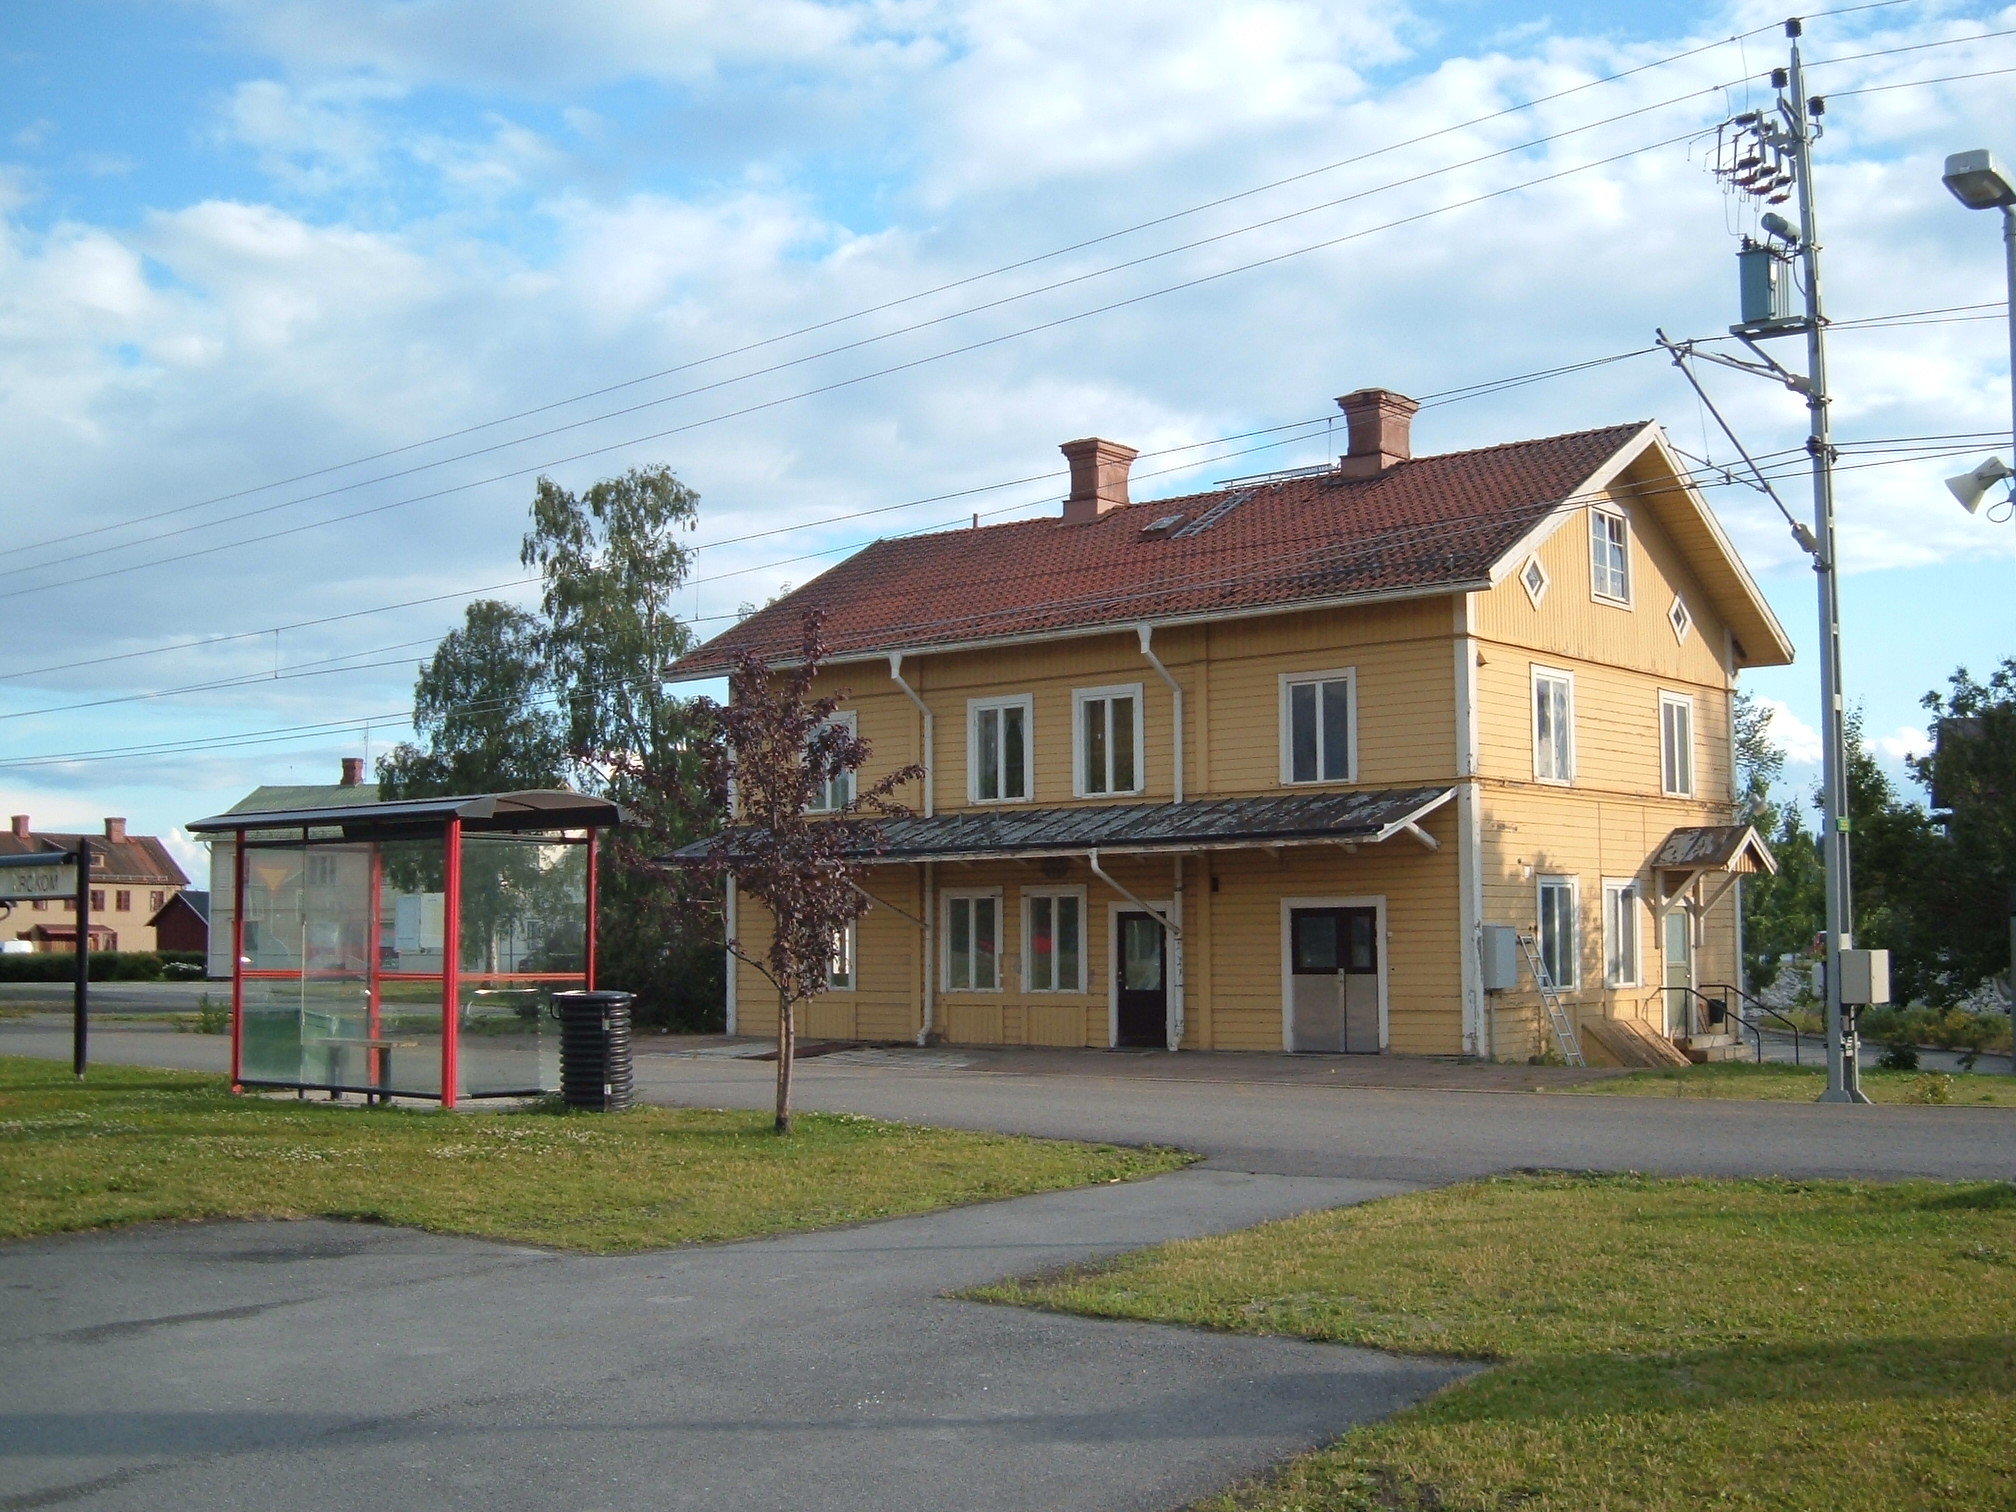
Fåker
Fåker is a village situated in Östersund Municipality, Jämtland County, Sweden with 209 inhabitants in 2005.
Fåker Wikipedia Page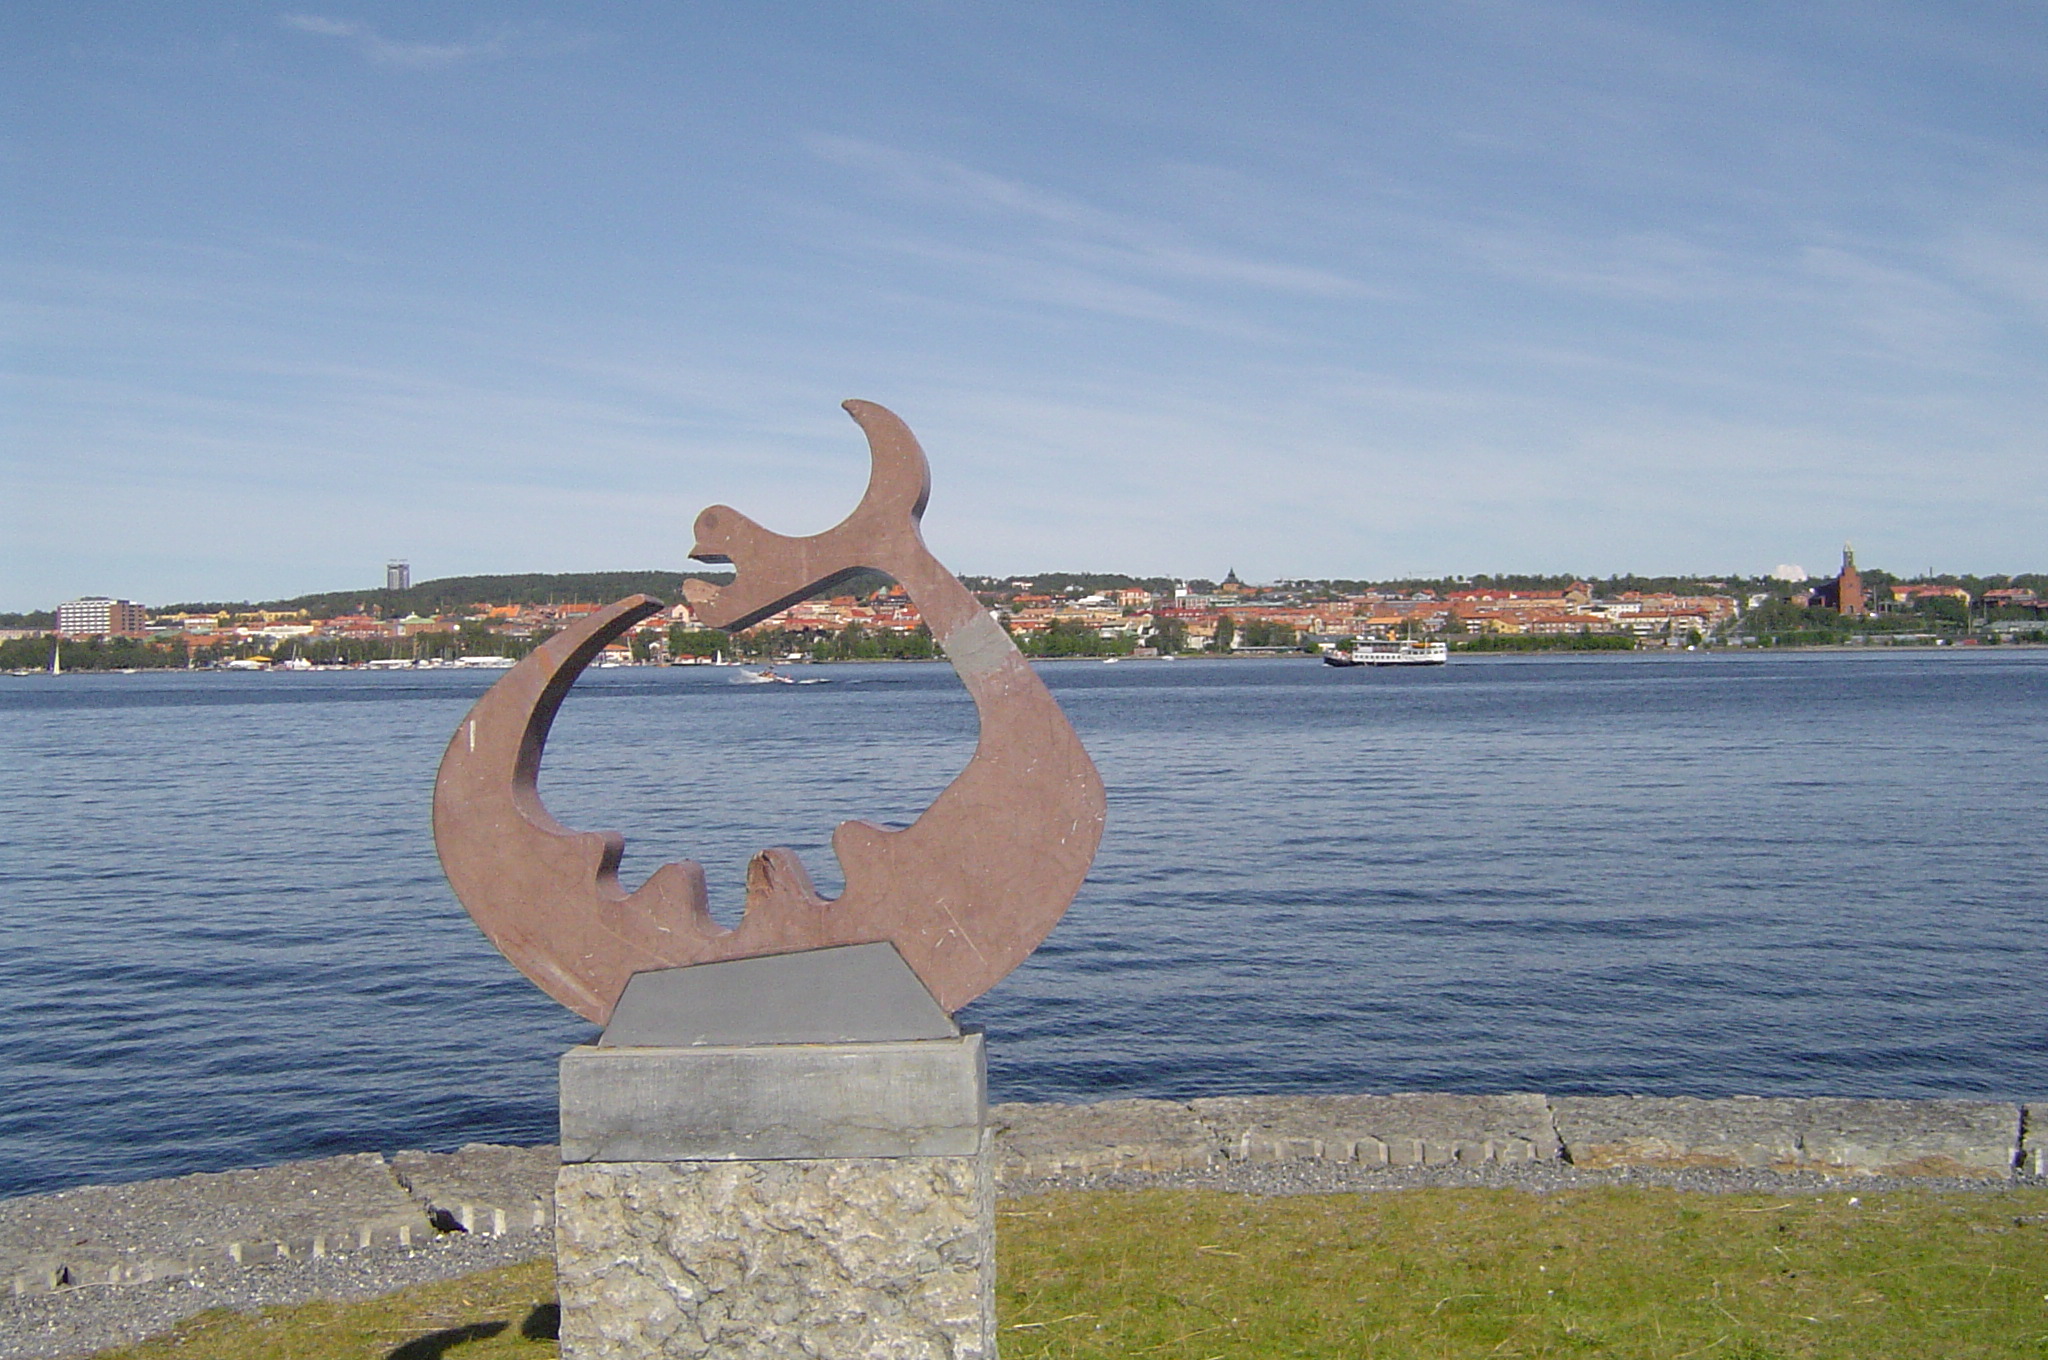
About Our Data
The data on this page is estimated using a number of publicly available tools and resources. It is provided without warranty, and could contain inaccuracies. Use at your own risk.