Industries
Business Distribution by Industry in Hackås
| Industry Description | Number of Establishments | Average Age of Business |
|---|---|---|
| Unreachable | 27 | 28 years |
| Construction of buildings | 17 | 22 years |
| Wholesale of machinery | 13 | 28 years |
| Buses and trains | 12 | — |
| Shopping other | 9 | 28 years |
| Shopping | 9 | 23 years |
| Restaurants | 7 | — |
| Education | 7 | — |
| Farming | 7 | 26 years |
| Other membership organizations | 7 | 35 years |
| Freight/commercial transport | 7 | — |
| Wholesalers | 6 | — |
| Electronics stores | 5 | — |
| Technical construction services | 5 | 28 years |
| Corporate management | 5 | — |
Map of Hackås
Interactive Map
Hackås Population
Years 1975 to 2030
| Data | 1975 | 1990 | 2000 | 2015 | 2020 | 2025* | 2030* |
|---|---|---|---|---|---|---|---|
| Population | 1,296 | 918 | 747 | 559 | 816 | 811 | 804 |
| Population Density | 518.4 / km² | 367.2 / km² | 298.8 / km² | 223.6 / km² | 326.4 / km² | 324.4 / km² | 321.6 / km² |
Hackås Population change from 2000 to 2020
Increase of 9.2% from year 2000 to 2020
| Location | Change since 1975 | Change since 1990 | Change since 2000 |
|---|---|---|---|
| Hackås | -37% | -11.1% | +9.2% |
| Jämtland County | — | — | — |
| Sweden | — | — | — |
Hackås Population Density
Population Density: 326 / km²
| Location | Population | Area | Density |
|---|---|---|---|
| Hackås | 816 | 2.5 km² | 326 / km² |
| Jämtland County | 125,863 | 54,086 km² | 2.3 / km² |
| Sweden | 9.6 million | 449,151.6 km² | 21.3 / km² |
Hackås Historical and Projected Population
Estimated Population from 0 to 2100
- JRC (European Commission's Joint Research Centre) work on the GHS built-up grid
- CIESIN (Center for International Earth Science Information Network)
- [Link] Klein Goldewijk, K., Beusen, A., Doelman, J., and Stehfest, E.: Anthropogenic land use estimates for the Holocene – HYDE 3.2, Earth Syst. Sci. Data, 9, 927–953, https://doi.org/10.5194/essd-9-927-2017, 2017.
Area Codes
Percentage Area Codes used by businesses in Hackås
Human Development Index (HDI)
Statistic composite index of life expectancy, education, and per capita income.
Hackås CO2 Emissions
Carbon Dioxide (CO2) Emissions Per Capita in Tonnes Per Year
| Location | CO2 Emissions | CO2 Emissions Per Capita | CO2 Emissions Intensity |
|---|---|---|---|
| Hackås | 7,772 tn | 9.52 tn | 3,108.7 tons/km² |
| Jämtland County | 1,200,468 tn | 9.54 tn | 22.2 tons/km² |
| Sweden | 93,354,240 tn | 9.75 tn | 207.8 tons/km² |
| 2013 CO2 emissions (tonnes/year) | 7,772 tn |
| 2013 CO2 emissions (tonnes/year) per capita | 9.52 tn |
| 2013 CO2 emissions intensity (tonnes/km²/year) | 3,108.7 tons/km² |
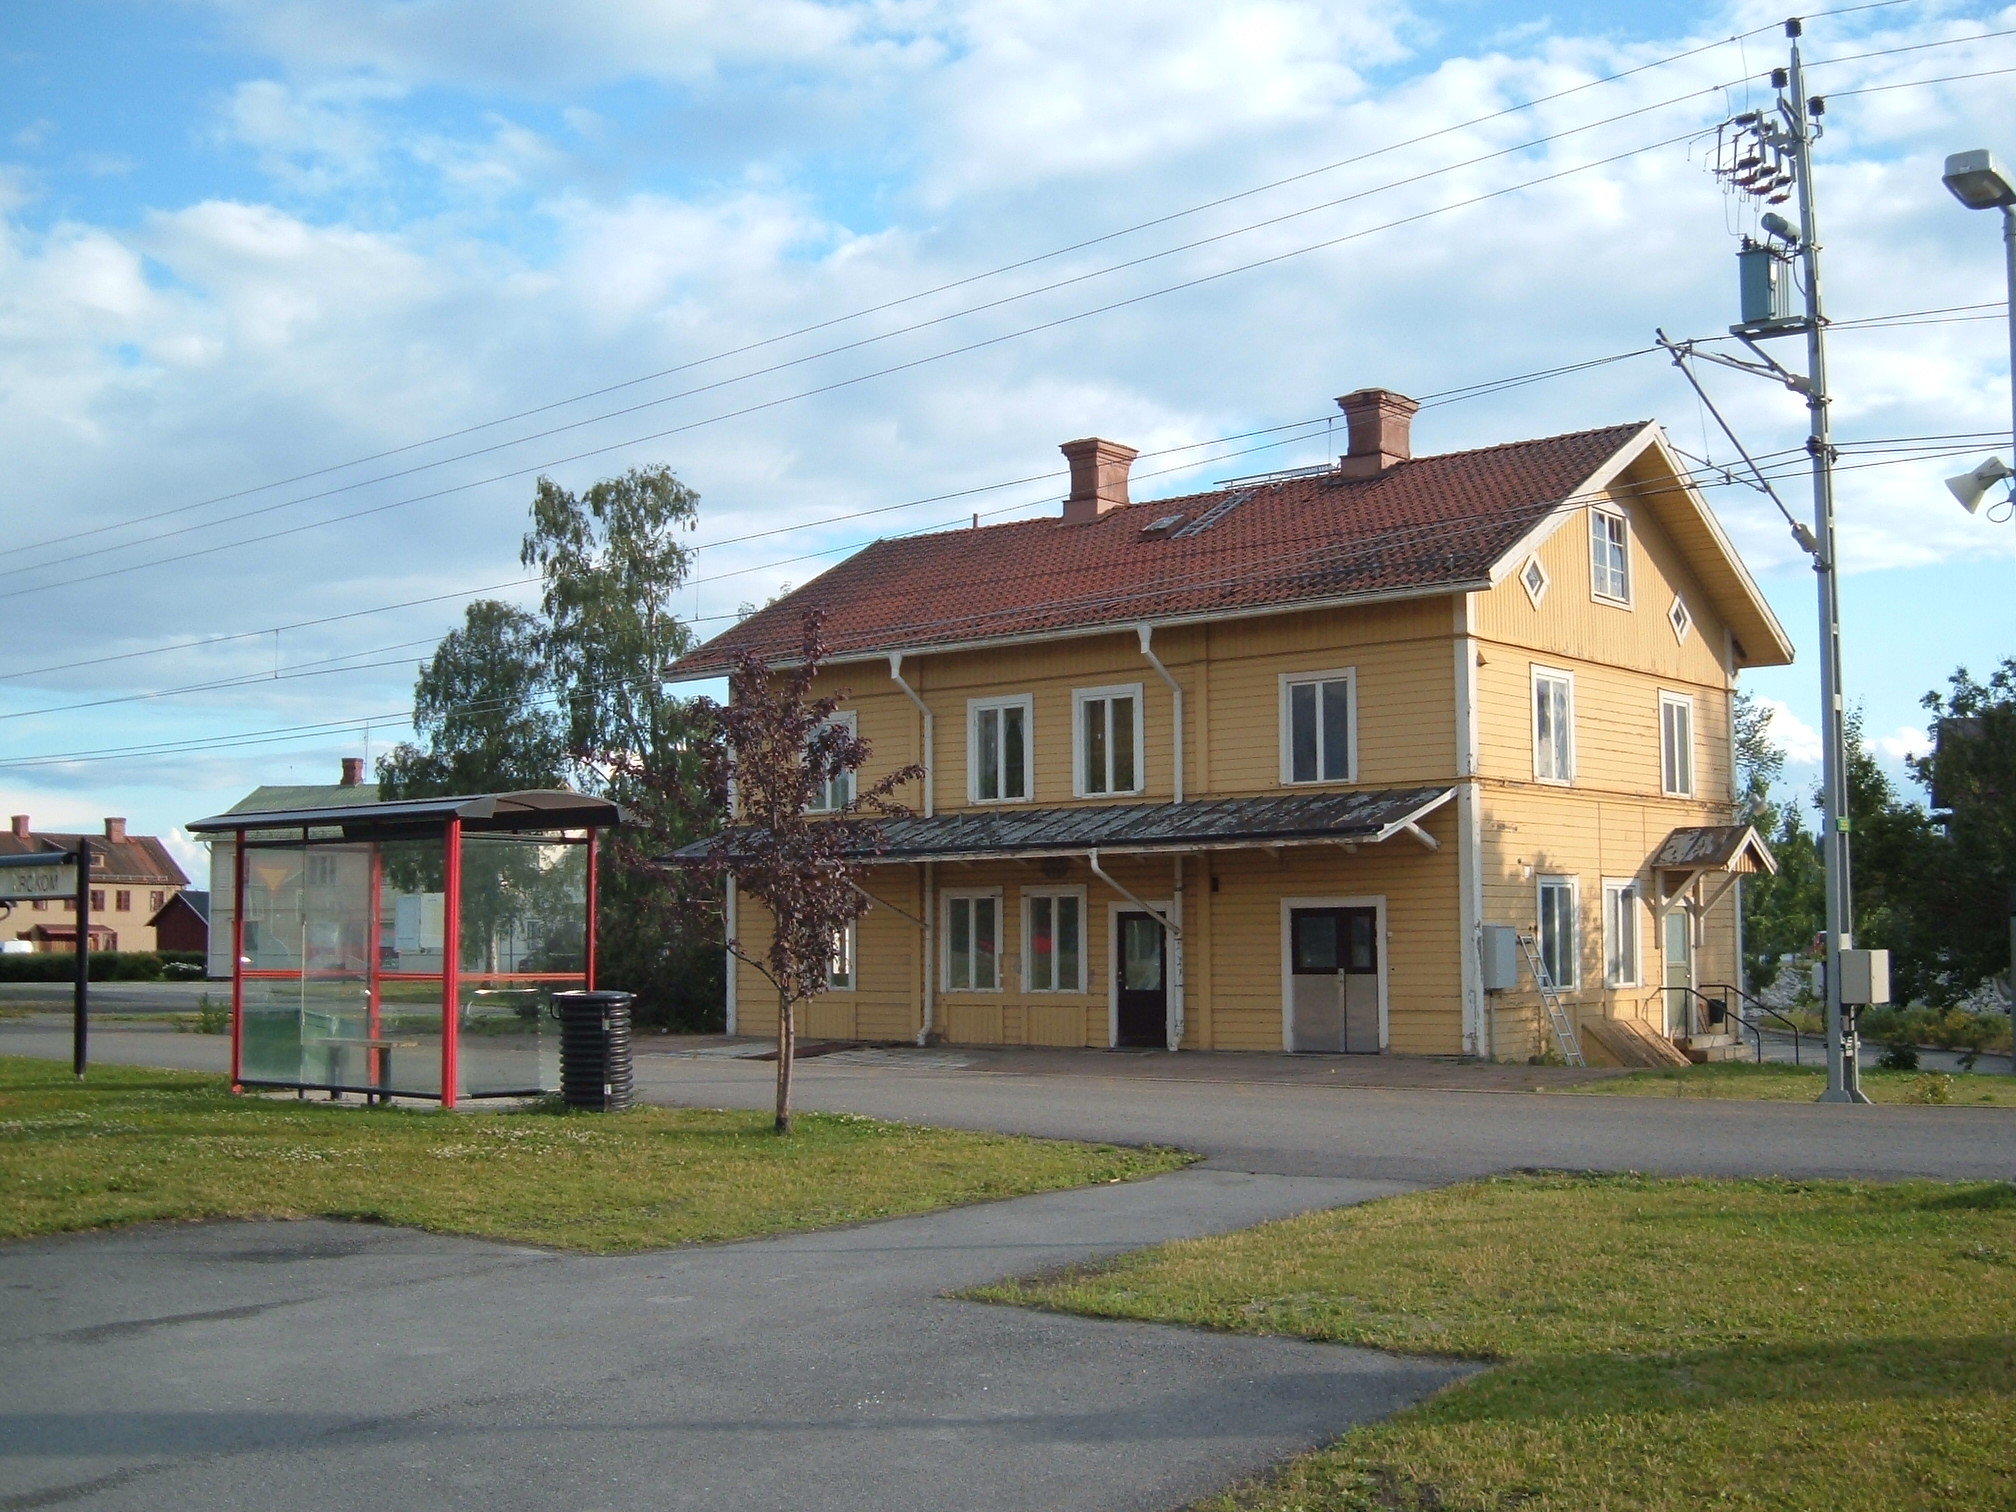
Hackås
Hackås is a locality situated in Berg Municipality, Jämtland County, Sweden with 480 inhabitants in 2010. Court District, or Hackås tingslag, was a district of Jämtland in Sweden. The provinces in Norrland were never divided into hundreds and instea..
Hackås Wikipedia Page
About Our Data
The data on this page is estimated using a number of publicly available tools and resources. It is provided without warranty, and could contain inaccuracies. Use at your own risk.