Industries
Business Distribution by Industry in Hedenäset
| Industry Description | Number of Establishments | Average Age of Business |
|---|---|---|
| Shopping other | 13 | 31 years |
| Other membership organizations | 13 | 34 years |
Hedenäset Facts
| Area | 4.3 km² |
| Population | 216 |
| Population change (1975 to 2020) | -57.1% |
| Population change (2000 to 2020) | -25.0% |
| Local Time | |
| Timezone | Central European Summer Time |
| Lat & Lng | 66.23333, 23.66667 |
| Postal Codes | 957 95 |
Map of Hedenäset
Interactive Map
Hedenäset Population
Years 1975 to 2020
| Data | 1975 | 1990 | 2000 | 2015 | 2020 |
|---|---|---|---|---|---|
| Population | 504 | 373 | 288 | 212 | 216 |
| Population Density | 116.9 / km² | 86.5 / km² | 66.8 / km² | 49.2 / km² | 50.1 / km² |
Sources: JRC (European Commission's Joint Research Centre) work on the GHS built-up grid
Hedenäset Population change from 2000 to 2015
Decrease of 26.4% from year 2000 to 2015
| Location | Change since 1975 | Change since 1990 | Change since 2000 |
|---|---|---|---|
| Hedenäset | -57.9% | -43.2% | -26.4% |
| Norrbotten | -19.3% | -11.2% | -5.5% |
| Sweden | +19.2% | +14.2% | +10.2% |
Sources: JRC (European Commission's Joint Research Centre) work on the GHS built-up grid
Hedenäset Population Density
Population Density: 50.1 / km²
| Location | Population | Area | Density |
|---|---|---|---|
| Hedenäset | 216 | 4.313 km² | 50.1 / km² |
| Norrbotten | 242,644 | 112,847.9 km² | 2.2 / km² |
| Sweden | 9.6 million | 449,151.6 km² | 21.3 / km² |
Sources: JRC (European Commission's Joint Research Centre) work on the GHS built-up grid
Hedenäset Historical and Projected Population
Estimated Population from 0 to 2100
Sources:
- JRC (European Commission's Joint Research Centre) work on the GHS built-up grid
- CIESIN (Center for International Earth Science Information Network)
- [Link] Klein Goldewijk, K., Beusen, A., Doelman, J., and Stehfest, E.: Anthropogenic land use estimates for the Holocene – HYDE 3.2, Earth Syst. Sci. Data, 9, 927–953, https://doi.org/10.5194/essd-9-927-2017, 2017.
Area Codes
Percentage Area Codes used by businesses in Hedenäset
Human Development Index (HDI)
Statistic composite index of life expectancy, education, and per capita income.
Source: [Link] Kummu, M., Taka, M. &Guillaume, J. Gridded global datasets for Gross Domestic Product and Human Development Index over 1990–2015. Sci Data 5, 180004 (2018) doi:10.1038/sdata.2018.4
Hedenäset CO2 Emissions
Carbon Dioxide (CO2) Emissions Per Capita in Tonnes Per Year
| Location | CO2 Emissions | CO2 Emissions Per Capita | CO2 Emissions Intensity |
|---|---|---|---|
| Hedenäset | 2,163 tn | 10.01 tn | 501.5 tons/km² |
| Norrbotten | 2,292,914 tn | 9.45 tn | 20.3 tons/km² |
| Sweden | 93,354,240 tn | 9.75 tn | 207.8 tons/km² |
Sources: [Link] Moran, D., Kanemoto K; Jiborn, M., Wood, R., Többen, J., and Seto, K.C. (2018) Carbon footprints of 13,000 cities. Environmental Research Letters DOI: 10.1088/1748-9326/aac72a
Hedenäset CO2 Emissions
| 2013 CO2 emissions (tonnes/year) | 2,163 tn |
| 2013 CO2 emissions (tonnes/year) per capita | 10.01 tn |
| 2013 CO2 emissions intensity (tonnes/km²/year) | 501.5 tons/km² |
Recent Nearby Earthquakes
Magnitude 3.0 and greater
| Date▼ | Time↕ | Magnitude↕ | Distance↕ | Depth↕ | Location↕ | Link |
|---|---|---|---|---|---|---|
| 6/27/18 | 7:22 AM | 3.5 | 65 km | 10,000 m | 15km SSW of Rolfs, Sweden | usgs.gov |
| 6/6/93 | 11:59 AM | 3.1 | 94.5 km | 10,000 m | Sweden | usgs.gov |
| 4/2/85 | 7:29 PM | 3.2 | 83.5 km | 10,000 m | Sweden | usgs.gov |
Source: U.S. Geological Survey (USGS)
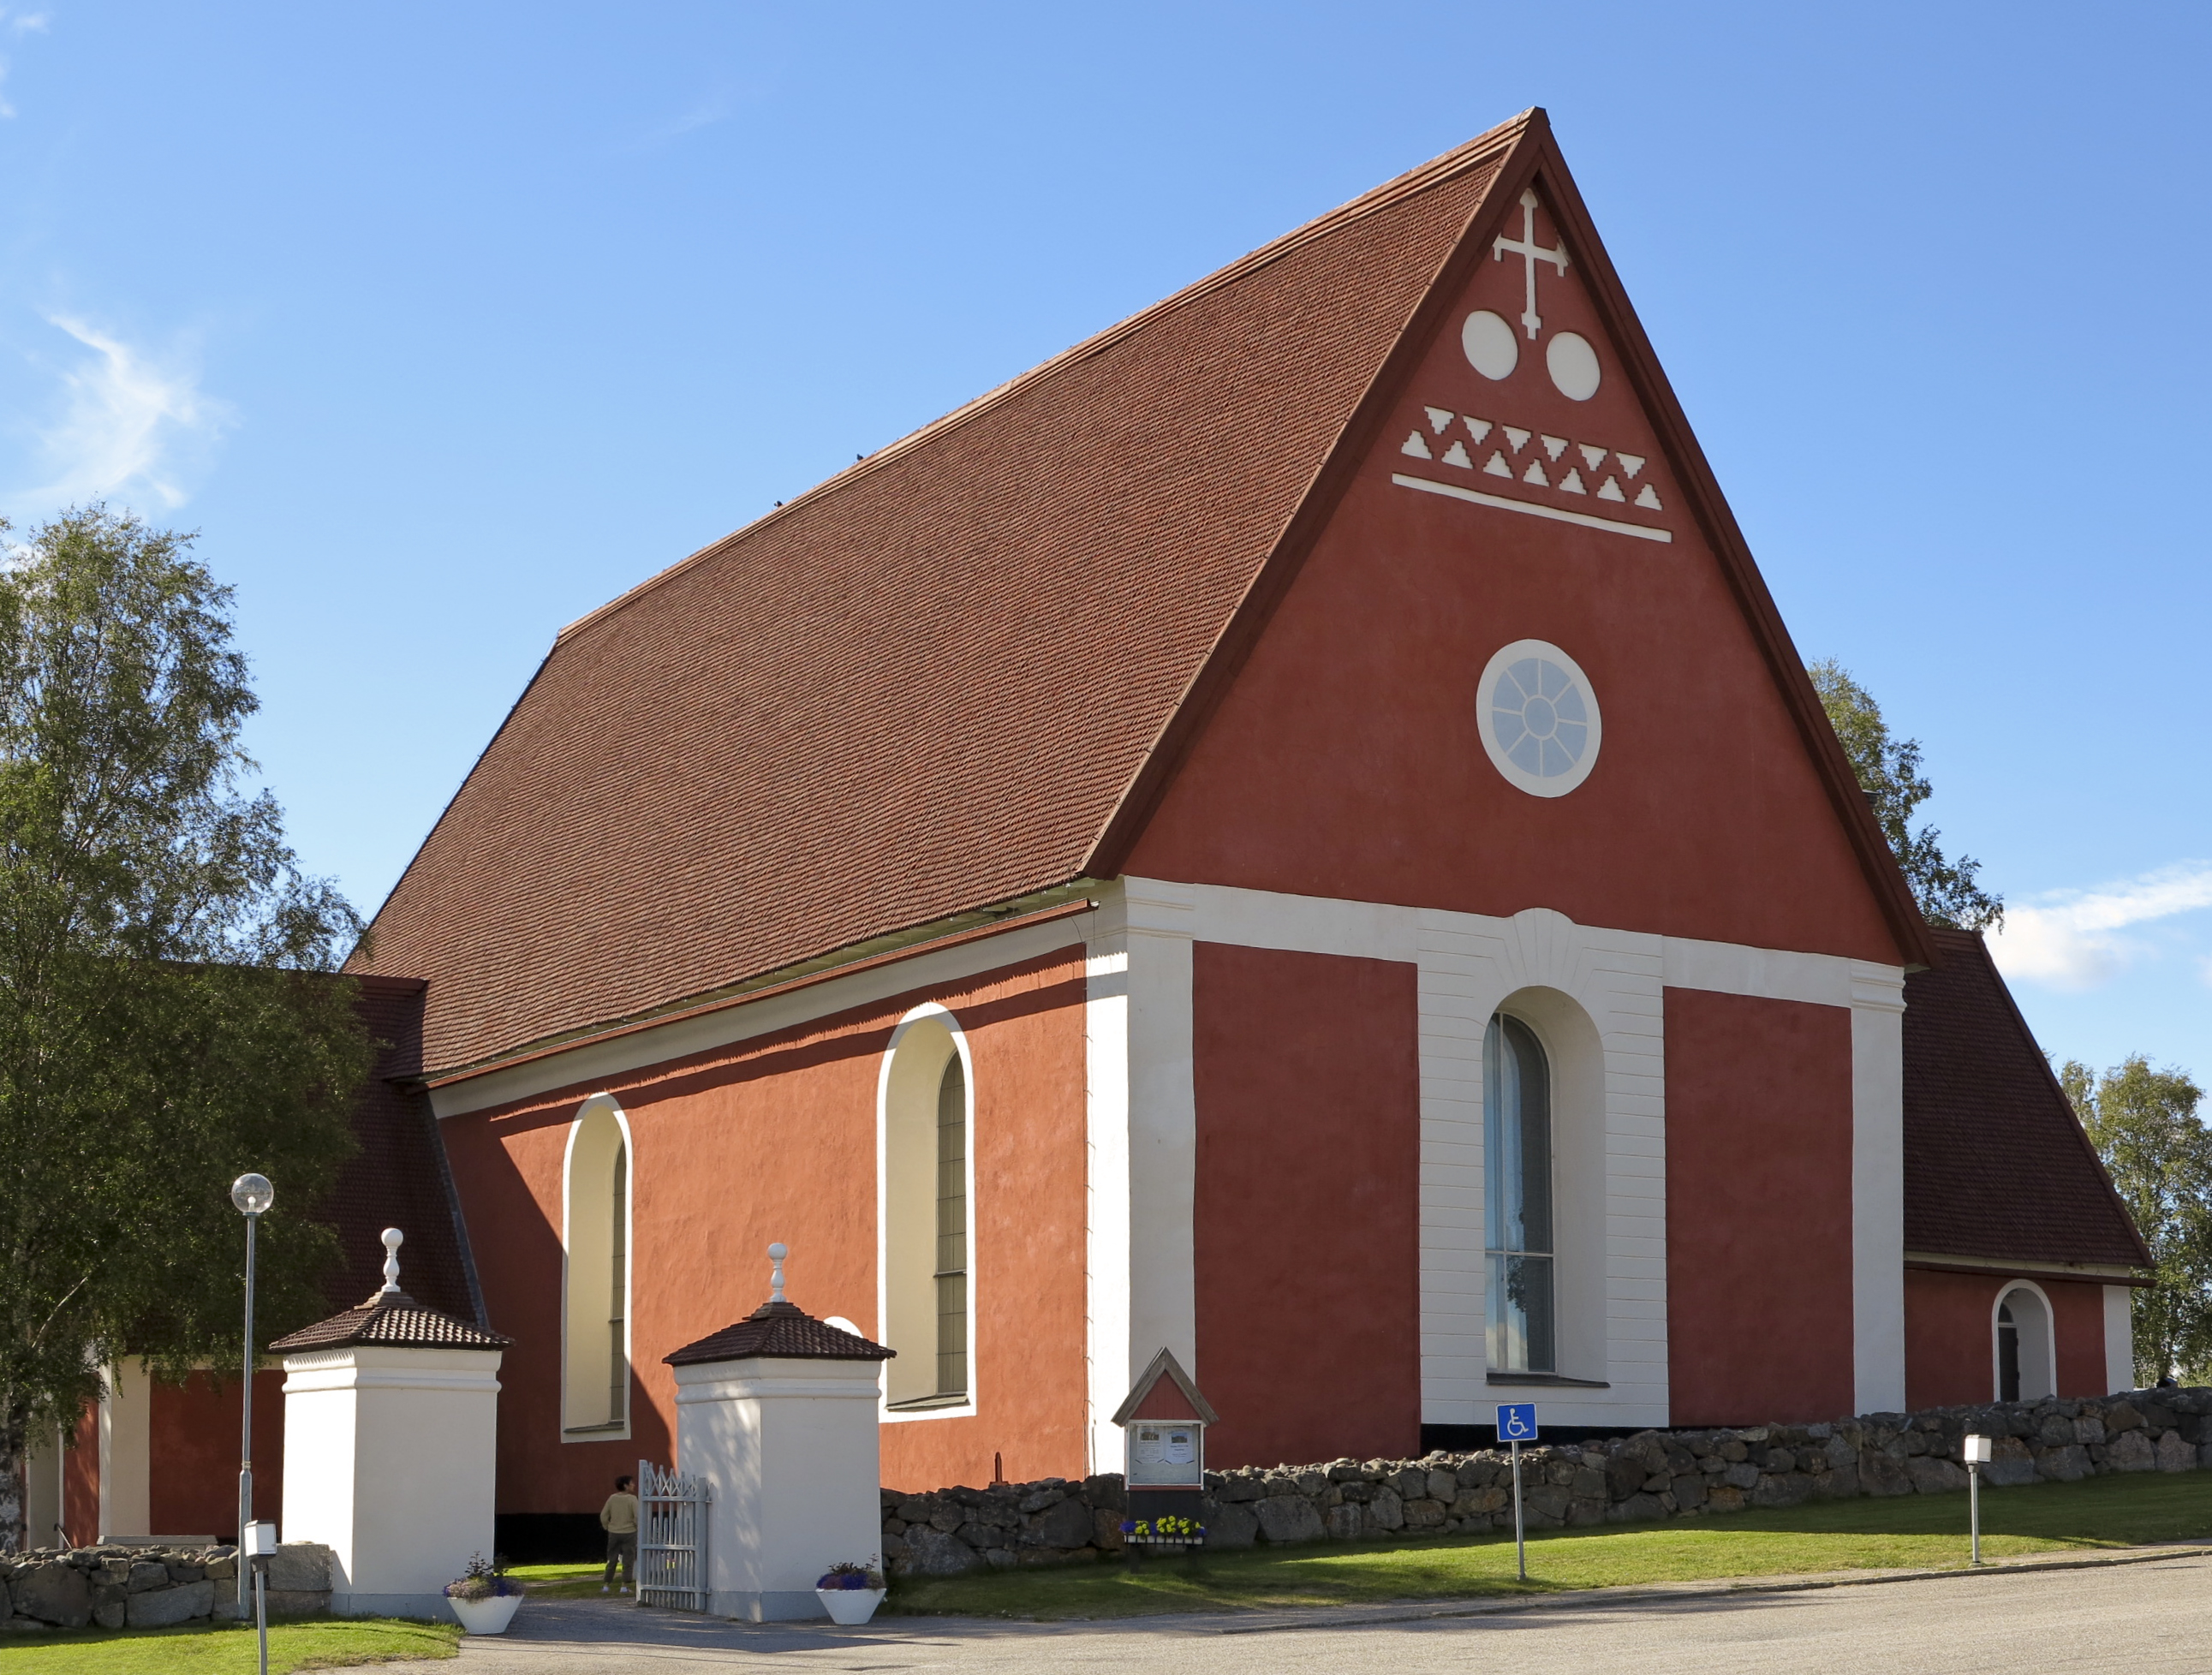
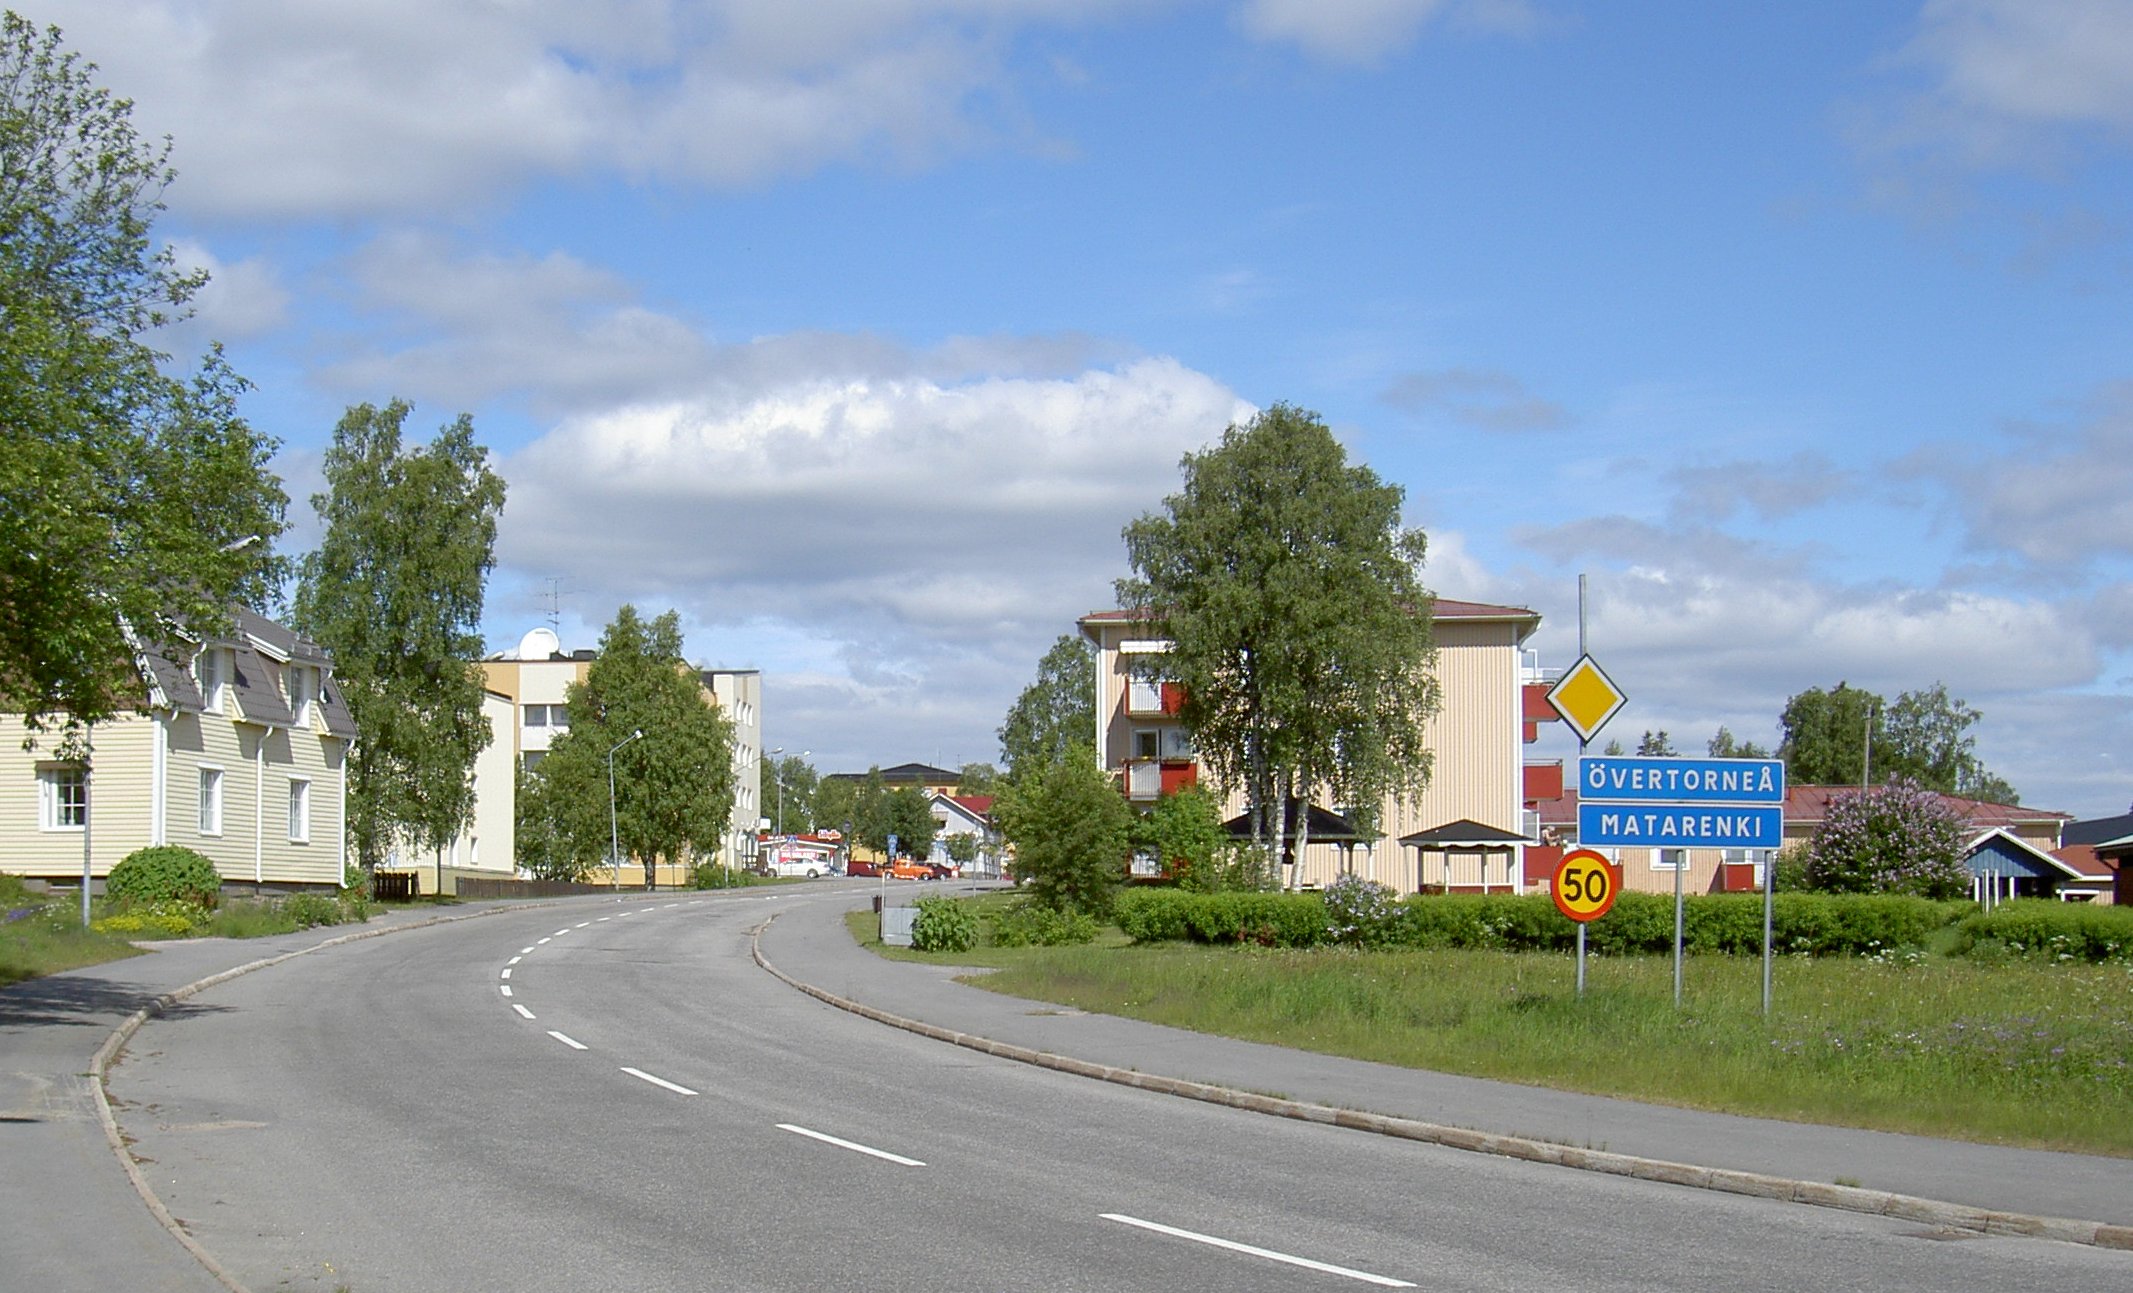
Hedenäset
Hedenäset is a locality situated in Övertorneå Municipality, Norrbotten County, Sweden with 270 inhabitants in 2010.
Hedenäset Wikipedia Page
About Our Data
The data on this page is estimated using a number of publicly available tools and resources. It is provided without warranty, and could contain inaccuracies. Use at your own risk.