Categories in Kallinge
Industries
Business Distribution by Industry in Kallinge
| Industry Description | Number of Establishments | Average Age of Business |
|---|---|---|
| Shopping other | 37 | 31 years |
| Unreachable | 35 | 27 years |
| Wholesale of machinery | 30 | 32 years |
| Farming | 30 | 24 years |
| Construction of buildings | 29 | 27 years |
| Other membership organizations | 24 | 37 years |
| Education | 19 | — |
| Buses and trains | 18 | — |
| Car repair | 16 | 29 years |
| Hairdressers | 15 | — |
| Shopping | 14 | 30 years |
| Restaurants | 14 | 25 years |
| Real estate | 13 | 36 years |
| Beauty salons | 12 | — |
| Technical construction services | 12 | 35 years |
| Corporate management | 11 | 21 years |
| Wholesalers | 10 | — |
| Electronics stores | 10 | 27 years |
Kallinge Facts
| Area | 7.6 km² |
| Population | 3,736 |
| Male Population | 1,927 (51.6%) |
| Female Population | 1,809 (48.4%) |
| Population change (1975 to 2020) | -46.5% |
| Population change (2000 to 2020) | -32.9% |
| Median Age | 44.4 years (Male: 42.7, Female: 46.3) |
| GDP per capita (PPP) | $38,411 (2022) |
| Neighborhoods | Galgamarken-Trossö |
| Local Time | |
| Timezone | Central European Summer Time |
| Lat & Lng | 56.23333, 15.28333 |
| Postal Codes | 372 02, 372 50, 372 51, 372 52, 372 53, More |
Map of Kallinge
Interactive Map
Kallinge Population
Years 1975 to 2030
| Data | 1975 | 1990 | 2000 | 2015 | 2020 | 2025* | 2030* |
|---|---|---|---|---|---|---|---|
| Population | 6,987 | 6,251 | 5,567 | 5,056 | 3,736 | 3,742 | 3,667 |
| Population Density | 923.9 / km² | 826.6 / km² | 736.1 / km² | 668.6 / km² | 494 / km² | 494.8 / km² | 484.9 / km² |
Kallinge Population change from 2000 to 2020
Decrease of 32.9% from year 2000 to 2020
| Location | Change since 1975 | Change since 1990 | Change since 2000 |
|---|---|---|---|
| Kallinge | -46.5% | -40.2% | -32.9% |
| Blekinge | — | — | — |
| Sweden | — | — | — |
Kallinge Median Age
Median Age: 44.4 years
| Location | Median Age | Median Age (Female) | Median Age (Male) |
|---|---|---|---|
| Kallinge | 44.4 yrs | 46.3 yrs | 42.7 yrs |
| Blekinge | 43.2 yrs | 45 yrs | 41.6 yrs |
| Sweden | 40.8 yrs | 41.8 yrs | 39.8 yrs |
Kallinge Population Density
Population Density: 494 / km²
| Location | Population | Area | Density |
|---|---|---|---|
| Kallinge | 3,736 | 7.6 km² | 494 / km² |
| Blekinge | 155,515 | 6,955.7 km² | 22.4 / km² |
| Sweden | 9.6 million | 449,151.6 km² | 21.3 / km² |
Kallinge Historical and Projected Population
Estimated Population from 0 to 2100
- JRC (European Commission's Joint Research Centre) work on the GHS built-up grid
- CIESIN (Center for International Earth Science Information Network)
- [Link] Klein Goldewijk, K., Beusen, A., Doelman, J., and Stehfest, E.: Anthropogenic land use estimates for the Holocene – HYDE 3.2, Earth Syst. Sci. Data, 9, 927–953, https://doi.org/10.5194/essd-9-927-2017, 2017.
Area Codes
Percentage Area Codes used by businesses in Kallinge
Postal Codes
Percentage of businesses by Postal Codes in Kallinge
Price Distribution
Business distribution by price for Kallinge
Human Development Index (HDI)
Statistic composite index of life expectancy, education, and per capita income.
Kallinge Gross Domestic Product (GDP)
GDP per capita, PPP (constant 2017 international $)
| Data | 1990 | 1995 | 2000 | 2005 | 2010 | 2015 | 2020 | 2022 |
|---|---|---|---|---|---|---|---|---|
| GDP per capita | $34,114 | $32,580 | $39,057 | $38,030 | $35,264 | $36,194 | $35,779 | $38,411 |
| Total GDP | $10.4M | $9.9M | $11.5M | $11.2M | $10.4M | $12M | $17.2M | $19.3M |
Kallinge CO2 Emissions
Carbon Dioxide (CO2) Emissions Per Capita in Tonnes Per Year
| Location | CO2 Emissions | CO2 Emissions Per Capita | CO2 Emissions Intensity |
|---|---|---|---|
| Kallinge | 35,623 tn | 9.54 tn | 4,710.5 tons/km² |
| Blekinge | 646,880 tn | 4.16 tn | 93 tons/km² |
| Sweden | 93,354,240 tn | 9.75 tn | 207.8 tons/km² |
| 2013 CO2 emissions (tonnes/year) | 35,623 tn |
| 2013 CO2 emissions (tonnes/year) per capita | 9.54 tn |
| 2013 CO2 emissions intensity (tonnes/km²/year) | 4,710.5 tons/km² |
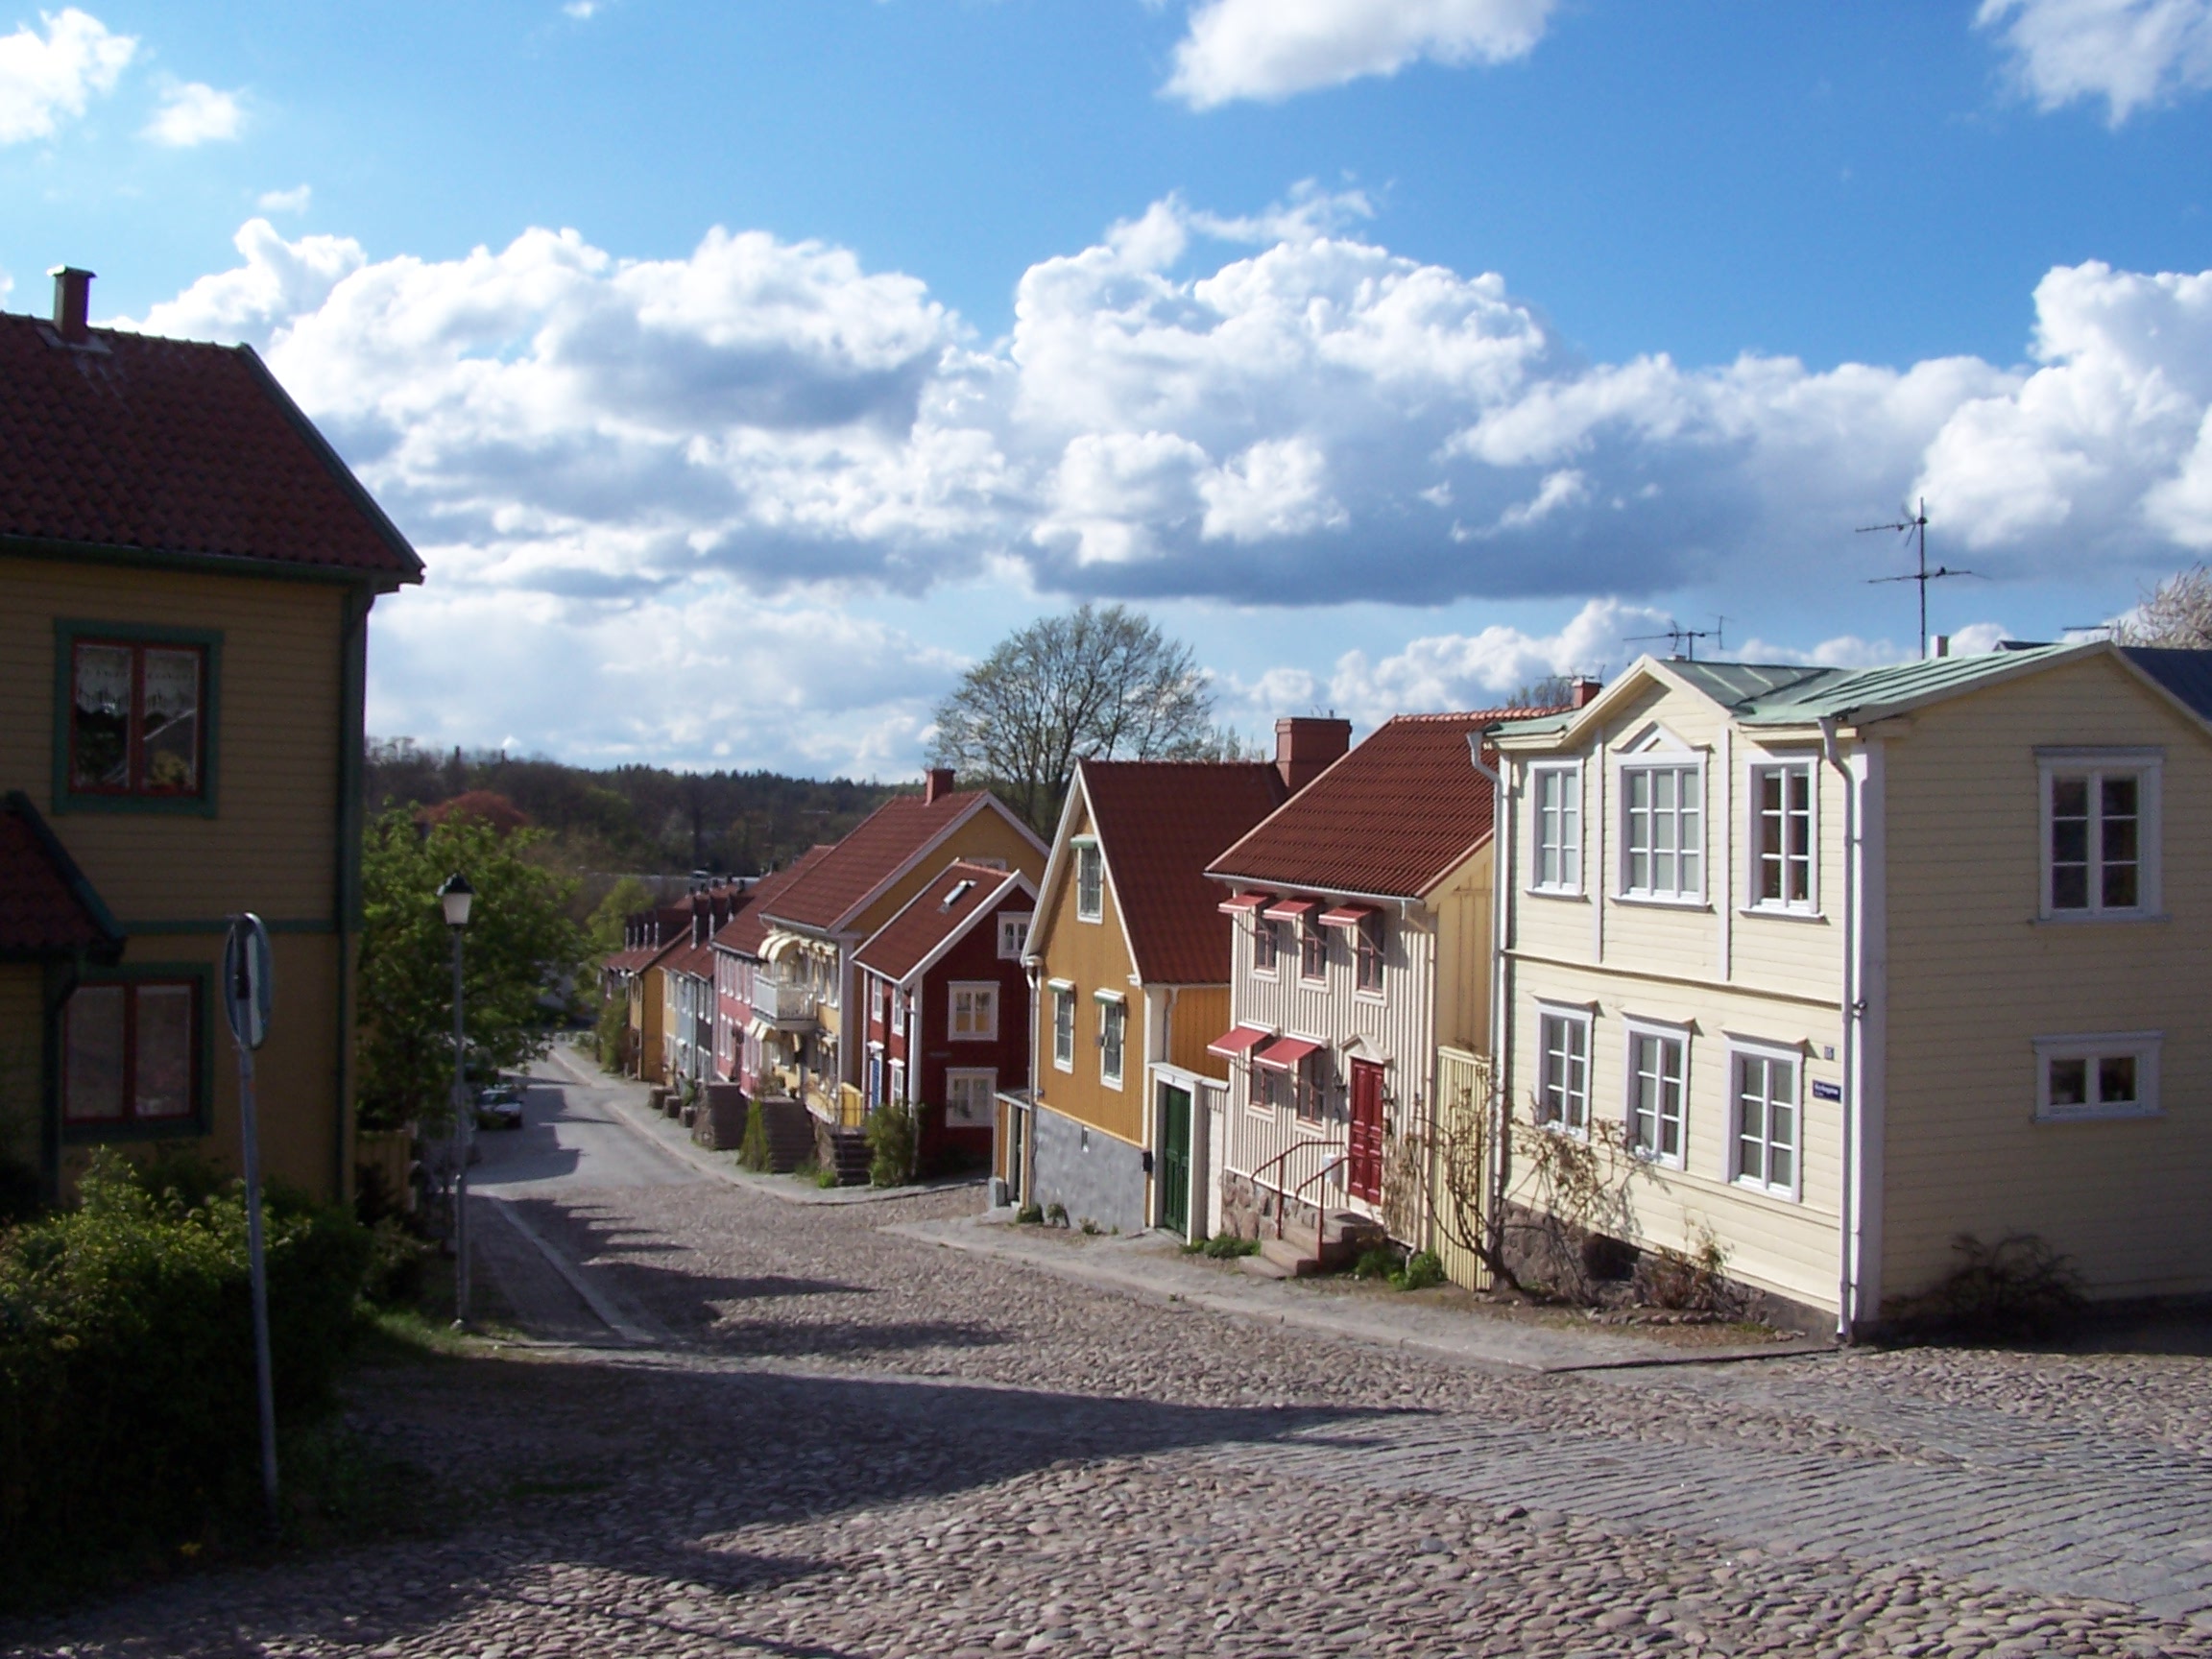
Kallinge
Kallinge is a locality situated in Ronneby Municipality, Blekinge County, Sweden with 4,561 inhabitants in 2010. It is an industrial and garrison town and is situated about 5 km north of Ronneby. settlement grew up around an ironworks in the latter ..
Kallinge Wikipedia Page

About Our Data
The data on this page is estimated using a number of publicly available tools and resources. It is provided without warranty, and could contain inaccuracies. Use at your own risk.