Karungi Facts
| Area | 3.4 km² |
| Population | 116 |
| Population change (1975 to 2020) | -22.7% |
| Population change (2000 to 2020) | -3.3% |
| Neighborhoods | Korpikylä |
| Local Time | |
| Timezone | Central European Summer Time |
| Lat & Lng | 66.05000, 23.95000 |
| Postal Codes | 953 93 |
Map of Karungi
Interactive Map
Karungi Population
Years 1975 to 2020
| Data | 1975 | 1990 | 2000 | 2015 | 2020 |
|---|---|---|---|---|---|
| Population | 150 | 131 | 120 | 112 | 116 |
| Population Density | 44.4 / km² | 38.8 / km² | 35.6 / km² | 33.2 / km² | 34.4 / km² |
Karungi Population change from 2000 to 2015
Decrease of 6.7% from year 2000 to 2015
| Location | Change since 1975 | Change since 1990 | Change since 2000 |
|---|---|---|---|
| Karungi | -25.3% | -14.5% | -6.7% |
| Norrbotten | -19.3% | -11.2% | -5.5% |
| Sweden | +19.2% | +14.2% | +10.2% |
Karungi Population Density
Population Density: 34.4 / km²
| Location | Population | Area | Density |
|---|---|---|---|
| Karungi | 116 | 3.375 km² | 34.4 / km² |
| Norrbotten | 242,644 | 112,847.9 km² | 2.2 / km² |
| Sweden | 9.6 million | 449,151.6 km² | 21.3 / km² |
Karungi Historical and Projected Population
Estimated Population from 200 to 2100
- JRC (European Commission's Joint Research Centre) work on the GHS built-up grid
- CIESIN (Center for International Earth Science Information Network)
- [Link] Klein Goldewijk, K., Beusen, A., Doelman, J., and Stehfest, E.: Anthropogenic land use estimates for the Holocene – HYDE 3.2, Earth Syst. Sci. Data, 9, 927–953, https://doi.org/10.5194/essd-9-927-2017, 2017.
Human Development Index (HDI)
Statistic composite index of life expectancy, education, and per capita income.
Karungi CO2 Emissions
Carbon Dioxide (CO2) Emissions Per Capita in Tonnes Per Year
| Location | CO2 Emissions | CO2 Emissions Per Capita | CO2 Emissions Intensity |
|---|---|---|---|
| Karungi | 1,161 tn | 10.01 tn | 344.1 tons/km² |
| Norrbotten | 2,292,914 tn | 9.45 tn | 20.3 tons/km² |
| Sweden | 93,354,240 tn | 9.75 tn | 207.8 tons/km² |
| 2013 CO2 emissions (tonnes/year) | 1,161 tn |
| 2013 CO2 emissions (tonnes/year) per capita | 10.01 tn |
| 2013 CO2 emissions intensity (tonnes/km²/year) | 344.1 tons/km² |
Natural Hazards Risk
Relative risk out of 10
| Hazard | Risk Level |
|---|---|
| Drought | Low (2) |
* Risk, particularly concerning flood or landslide, may not be for the entire area.
- Dilley, M., R.S. Chen, U. Deichmann, A.L. Lerner-Lam, M. Arnold, J. Agwe, P. Buys, O. Kjekstad, B. Lyon, and G. Yetman. 2005. Natural Disaster Hotspots: A Global Risk Analysis. Washington, D.C.: World Bank. https://doi.org/10.1596/0-8213-5930-4.
- Center for Hazards and Risk Research - CHRR - Columbia University, Center for International Earth Science Information Network - CIESIN - Columbia University, and International Research Institute for Climate and Society - IRI - Columbia University. 2005. Global Drought Hazard Frequency and Distribution. Palisades, NY: NASA Socioeconomic Data and Applications Center (SEDAC). https://doi.org/10.7927/H4VX0DFT.
Recent Nearby Earthquakes
Magnitude 3.0 and greater
| Date▼ | Time↕ | Magnitude↕ | Distance↕ | Depth↕ | Location↕ | Link |
|---|---|---|---|---|---|---|
| 6/27/18 | 7:22 AM | 3.5 | 58 km | 10,000 m | 15km SSW of Rolfs, Sweden | usgs.gov |
| 6/6/91 | 12:46 PM | 3.1 | 88.7 km | 10,000 m | Sweden | usgs.gov |
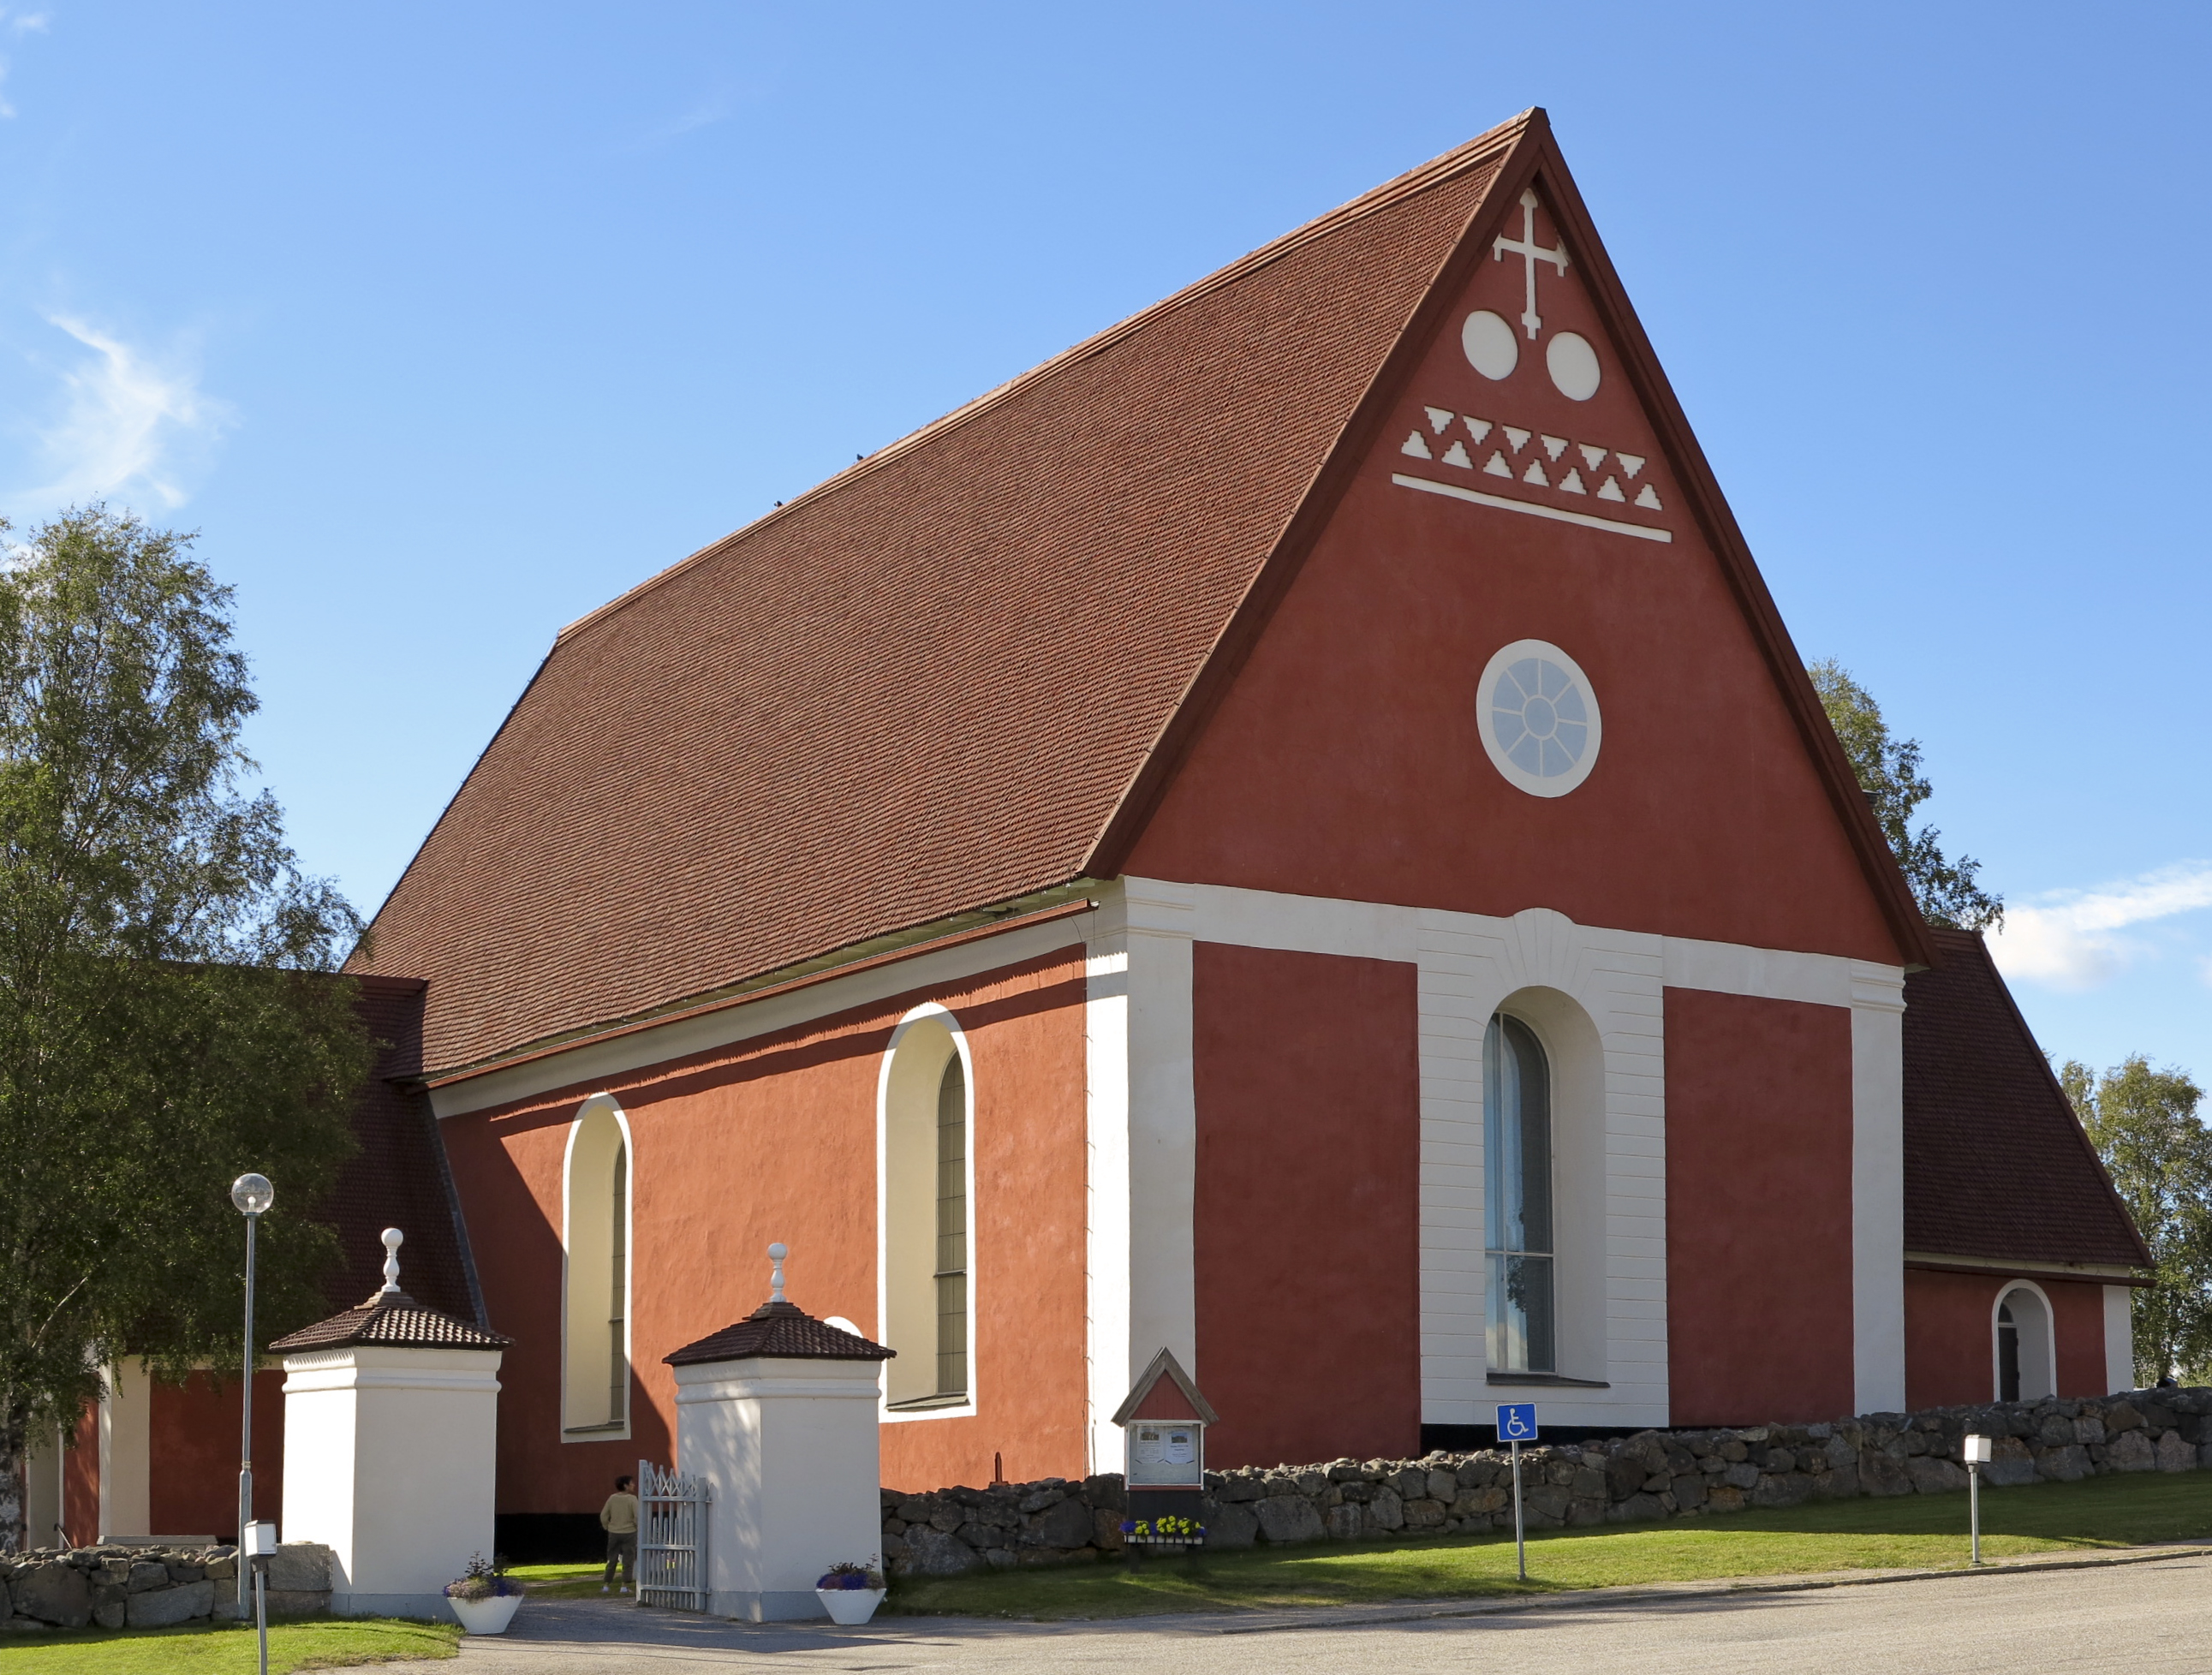
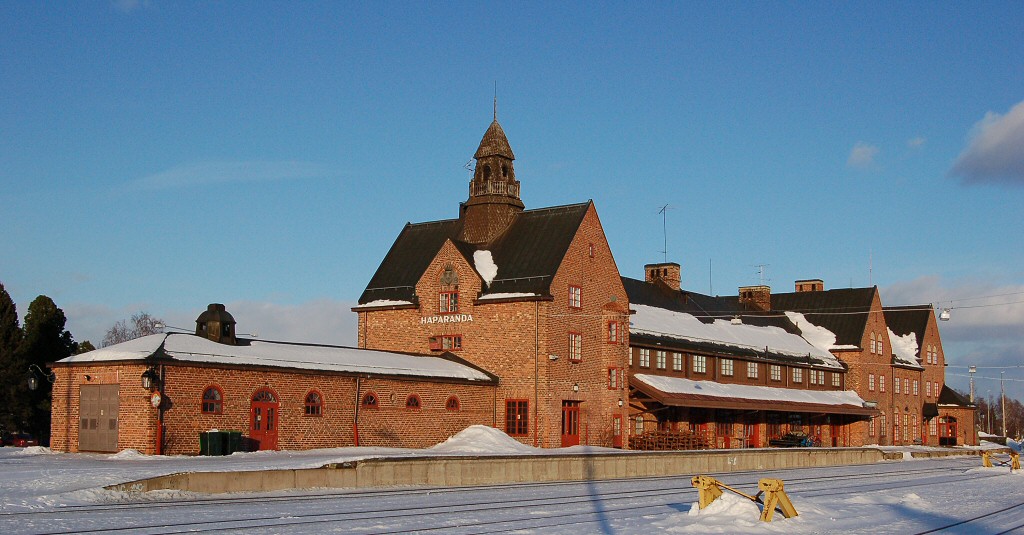
Karungi
Karungi is a locality situated in Haparanda Municipality, Norrbotten County, Sweden with 232 inhabitants in 2010. The language most spoken in the village is Meänkieli, which the first of April 2000 officially was declared as a minority language in Sw..
Karungi Wikipedia Page
About Our Data
The data on this page is estimated using a number of publicly available tools and resources. It is provided without warranty, and could contain inaccuracies. Use at your own risk.