Categories in Strömsund
Industries
Business Distribution by Industry in Strömsund
| Industry Description | Number of Establishments | Average Age of Business |
|---|---|---|
| Unreachable | 129 | 28 years |
| Other membership organizations | 89 | 32 years |
| Wholesale of machinery | 86 | 30 years |
| Shopping other | 65 | 26 years |
| Construction of buildings | 51 | 28 years |
| Farming | 40 | 24 years |
| Real estate | 36 | 35 years |
| Restaurants | 35 | 20 years |
| Wholesalers | 31 | 29 years |
| Technical construction services | 31 | 32 years |
| Shopping | 30 | 24 years |
| Education | 29 | — |
| Forestry and logging | 27 | 23 years |
| Buses and trains | 25 | — |
| Hairdressers | 23 | 23 years |
| Car repair | 22 | 28 years |
Strömsund Facts
| Area | 3.5 km² |
| Population | 2,828 |
| Population change (1975 to 2020) | -54.1% |
| Population change (2000 to 2020) | -23.3% |
| Area Codes | 670 |
| Neighborhoods | Täxan, Hallviken, Bredkälen, Ulriksfors, Yxskaftkälen |
| Local Time | |
| Timezone | Central European Summer Time |
| Lat & Lng | 63.85206, 15.55583 |
| Postal Codes | 833 01, 833 17, 833 18, 833 19, 833 20, More |
Map of Strömsund
Interactive Map
Strömsund Population
Years 1975 to 2020
| Data | 1975 | 1990 | 2000 | 2015 | 2020 |
|---|---|---|---|---|---|
| Population | 6,159 | 4,559 | 3,688 | 2,795 | 2,828 |
| Population Density | 1,759.7 / km² | 1,302.6 / km² | 1,053.7 / km² | 798.6 / km² | 808 / km² |
Strömsund Population change from 2000 to 2015
Decrease of 24.2% from year 2000 to 2015
| Location | Change since 1975 | Change since 1990 | Change since 2000 |
|---|---|---|---|
| Strömsund | -54.6% | -38.7% | -24.2% |
| Jämtland County | -14.8% | -7.8% | -3.3% |
| Sweden | +19.2% | +14.2% | +10.2% |
Strömsund Population Density
Population Density: 808 / km²
| Location | Population | Area | Density |
|---|---|---|---|
| Strömsund | 2,828 | 3.5 km² | 808 / km² |
| Jämtland County | 125,863 | 54,086 km² | 2.3 / km² |
| Sweden | 9.6 million | 449,151.6 km² | 21.3 / km² |
Strömsund Historical and Projected Population
Estimated Population from 1200 to 2100
- JRC (European Commission's Joint Research Centre) work on the GHS built-up grid
- CIESIN (Center for International Earth Science Information Network)
- [Link] Klein Goldewijk, K., Beusen, A., Doelman, J., and Stehfest, E.: Anthropogenic land use estimates for the Holocene – HYDE 3.2, Earth Syst. Sci. Data, 9, 927–953, https://doi.org/10.5194/essd-9-927-2017, 2017.
Neighborhoods in Strömsund
Percentage of businesses by neighborhood in Strömsund
Area Codes
Percentage Area Codes used by businesses in Strömsund
Postal Codes
Percentage of businesses by Postal Codes in Strömsund
Price Distribution
Business distribution by price for Strömsund
Human Development Index (HDI)
Statistic composite index of life expectancy, education, and per capita income.
Strömsund CO2 Emissions
Carbon Dioxide (CO2) Emissions Per Capita in Tonnes Per Year
| Location | CO2 Emissions | CO2 Emissions Per Capita | CO2 Emissions Intensity |
|---|---|---|---|
| Strömsund | 26,935 tn | 9.52 tn | 7,695.7 tons/km² |
| Jämtland County | 1,200,468 tn | 9.54 tn | 22.2 tons/km² |
| Sweden | 93,354,240 tn | 9.75 tn | 207.8 tons/km² |
| 2013 CO2 emissions (tonnes/year) | 26,935 tn |
| 2013 CO2 emissions (tonnes/year) per capita | 9.52 tn |
| 2013 CO2 emissions intensity (tonnes/km²/year) | 7,695.7 tons/km² |
Recent Nearby Earthquakes
Magnitude 3.0 and greater
| Date▼ | Time↕ | Magnitude↕ | Distance↕ | Depth↕ | Location↕ | Link |
|---|---|---|---|---|---|---|
| 9/29/83 | 5:03 AM | 4.1 | 98.2 km | 10,000 m | Sweden | usgs.gov |
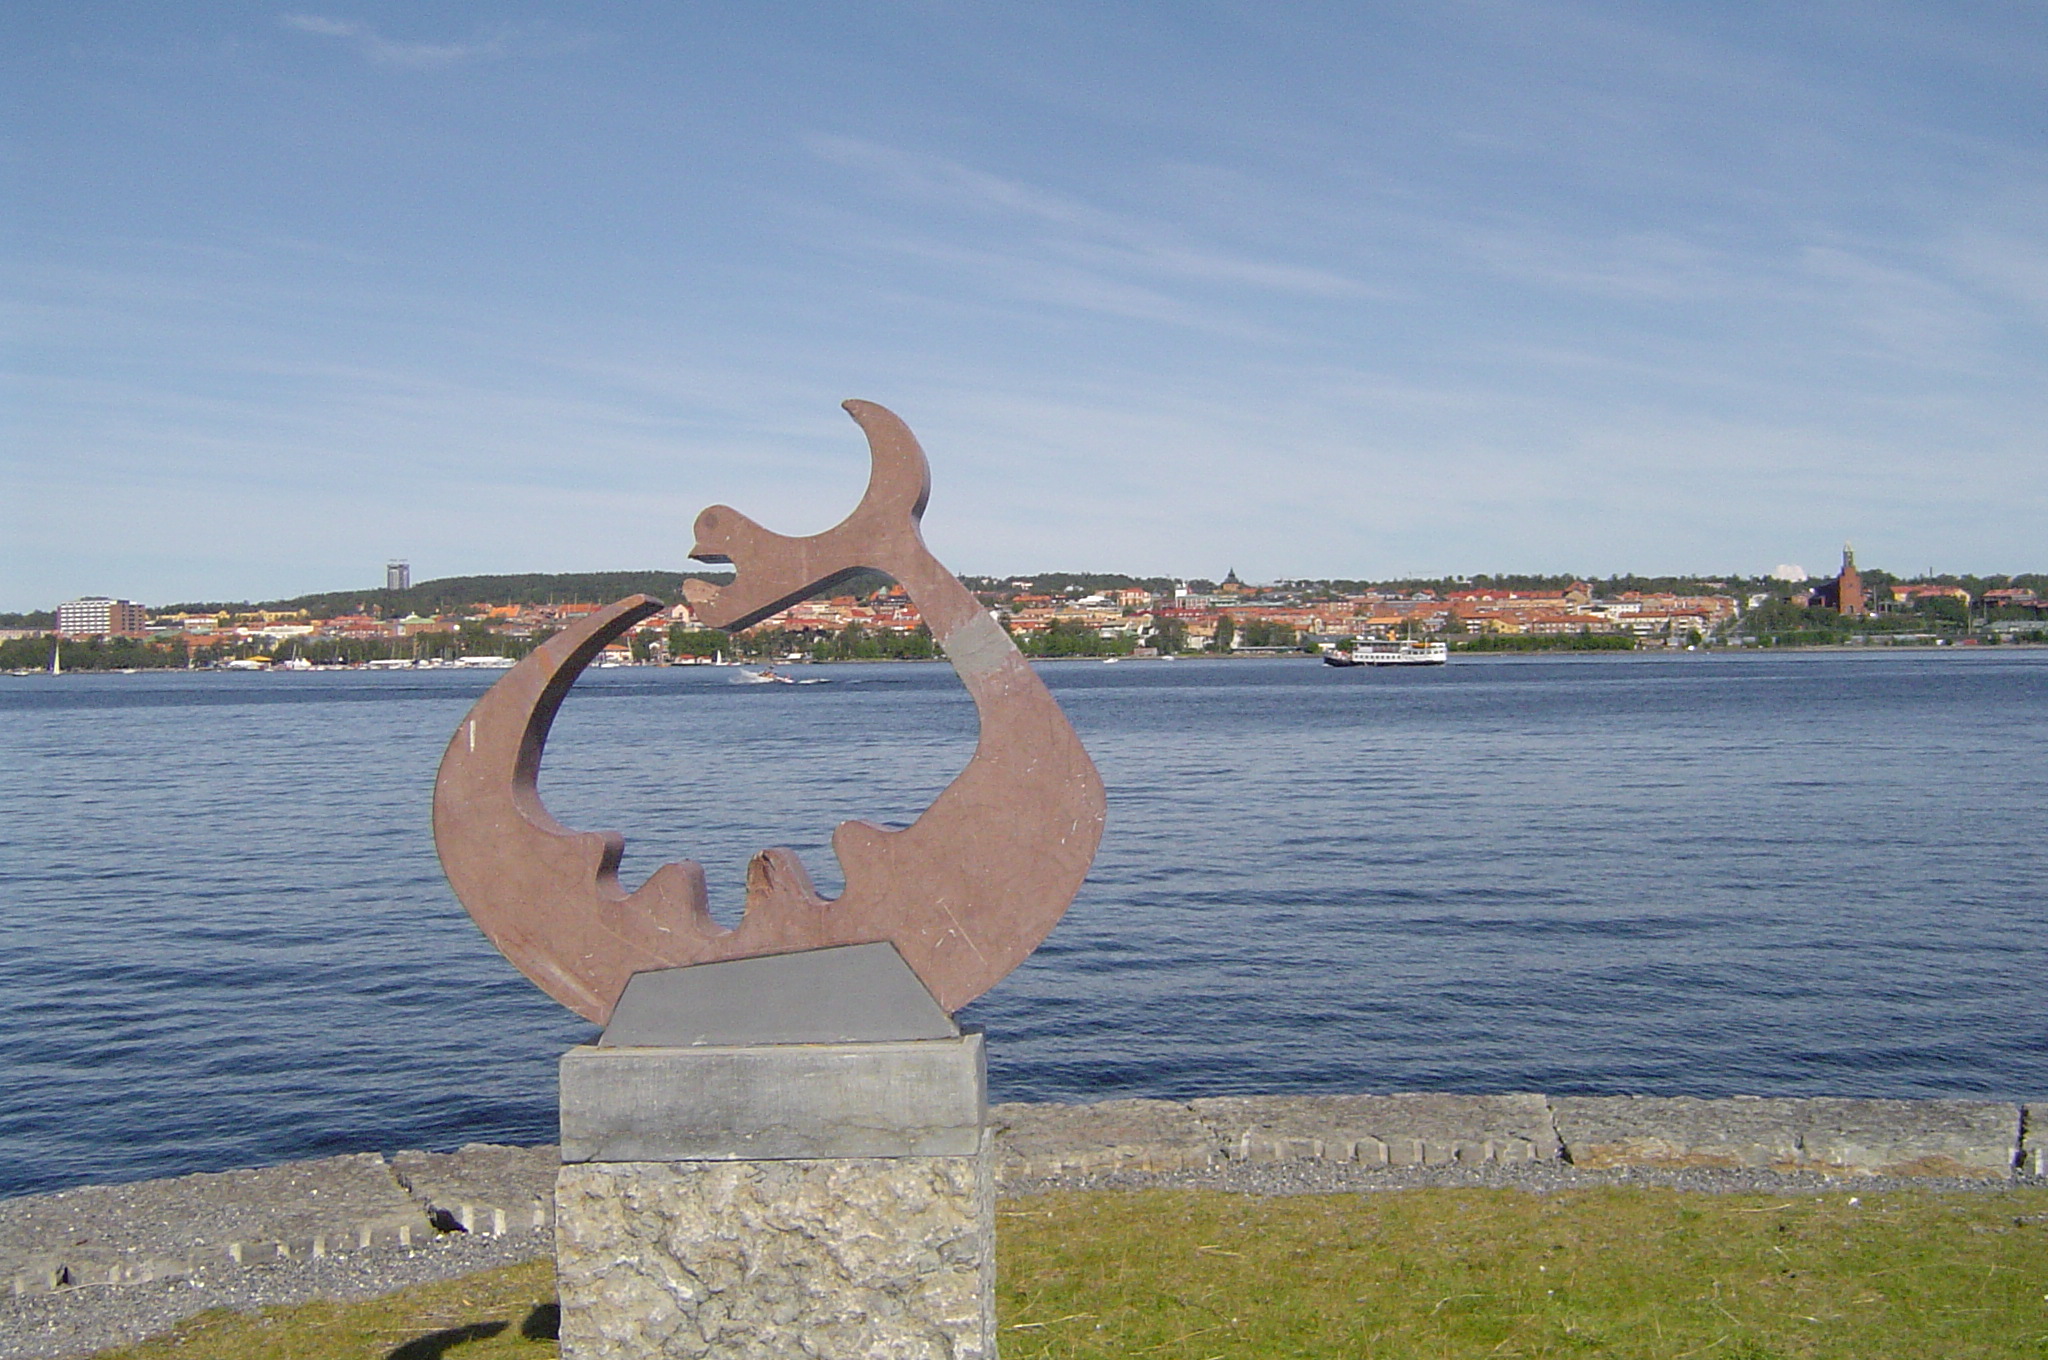
Strömsund
Strömsund (Southern Sami: Straejmie) is a locality and the seat of Strömsund Municipality in Jämtland County, Sweden with 3,589 inhabitants in 2010.
Strömsund Wikipedia Page
About Our Data
The data on this page is estimated using a number of publicly available tools and resources. It is provided without warranty, and could contain inaccuracies. Use at your own risk.