Categories in Sälen
Industries
Business Distribution by Industry in Sälen
| Industry Description | Number of Establishments | Average Age of Business | Average Google Rating |
|---|---|---|---|
| Restaurants | 38 | 26 years | 4 |
| Other accommodation | 27 | 31 years | 4.3 |
| Shopping | 23 | — | 4 |
| Ski hills | 19 | 26 years | 4.4 |
| Hotels and motels | 19 | 31 years | 4.2 |
| Holiday homes, cabins and resorts | 11 | — | 4.4 |
| Cafes | 11 | — | 3.6 |
| Sporting goods | 10 | — | 4.1 |
| Bars, pubs and taverns | 9 | — | 4.1 |
| Grocery stores and supermarkets | 9 | — | 3.9 |
| Gas station | 8 | — | 4.1 |
| Travel agencies | 6 | — | 4.4 |
| Clothing stores | 6 | — | 3.9 |
| Household appliances and goods | 6 | — | 4.8 |
| All food and beverage | 6 | — | 3.9 |
| Pizza | 6 | — | 4.2 |
| Hostels | 5 | — | 4.3 |
| Construction of buildings | 5 | — | 5 |
| Real estate | 5 | — | 4.4 |
Sälen Facts
| Area | 1.9 km² |
| Population | 316 |
| Population change (1975 to 2020) | -43.0% |
| Population change (2000 to 2020) | -4.2% |
| Neighborhoods | Sälen |
| Local Time | |
| Timezone | Central European Summer Time |
| Lat & Lng | 61.15000, 13.26667 |
| Postal Codes | 780 67 |
Map of Sälen
Interactive Map
Sälen Population
Years 1975 to 2020
| Data | 1975 | 1990 | 2000 | 2015 | 2020 |
|---|---|---|---|---|---|
| Population | 554 | 392 | 330 | 302 | 316 |
| Population Density | 295.5 / km² | 209.1 / km² | 176 / km² | 161.1 / km² | 168.5 / km² |
Sälen Population change from 2000 to 2015
Decrease of 8.5% from year 2000 to 2015
| Location | Change since 1975 | Change since 1990 | Change since 2000 |
|---|---|---|---|
| Sälen | -45.5% | -23% | -8.5% |
| Dalarna County | -7.4% | -3.4% | -0.7% |
| Sweden | +19.2% | +14.2% | +10.2% |
Sälen Population Density
Population Density: 169 / km²
| Location | Population | Area | Density |
|---|---|---|---|
| Sälen | 316 | 1.875 km² | 169 / km² |
| Dalarna County | 275,878 | 30,386.9 km² | 9.1 / km² |
| Sweden | 9.6 million | 449,151.6 km² | 21.3 / km² |
Sälen Historical and Projected Population
Estimated Population from 0 to 2100
- JRC (European Commission's Joint Research Centre) work on the GHS built-up grid
- CIESIN (Center for International Earth Science Information Network)
- [Link] Klein Goldewijk, K., Beusen, A., Doelman, J., and Stehfest, E.: Anthropogenic land use estimates for the Holocene – HYDE 3.2, Earth Syst. Sci. Data, 9, 927–953, https://doi.org/10.5194/essd-9-927-2017, 2017.
Area Codes
Percentage Area Codes used by businesses in Sälen
Price Distribution
Business distribution by price for Sälen
Human Development Index (HDI)
Statistic composite index of life expectancy, education, and per capita income.
Sälen CO2 Emissions
Carbon Dioxide (CO2) Emissions Per Capita in Tonnes Per Year
| Location | CO2 Emissions | CO2 Emissions Per Capita | CO2 Emissions Intensity |
|---|---|---|---|
| Sälen | 3,086 tn | 9.76 tn | 1,645.7 tons/km² |
| Dalarna County | 2,693,850 tn | 9.76 tn | 88.7 tons/km² |
| Sweden | 93,354,240 tn | 9.75 tn | 207.8 tons/km² |
| 2013 CO2 emissions (tonnes/year) | 3,086 tn |
| 2013 CO2 emissions (tonnes/year) per capita | 9.76 tn |
| 2013 CO2 emissions intensity (tonnes/km²/year) | 1,645.7 tons/km² |
Recent Nearby Earthquakes
Magnitude 3.0 and greater
| Date▼ | Time↕ | Magnitude↕ | Distance↕ | Depth↕ | Location↕ | Link |
|---|---|---|---|---|---|---|
| 9/15/14 | 1:08 PM | 4.6 | 77.1 km | 15,840 m | 41km NNE of AElvdalen, Sweden | usgs.gov |
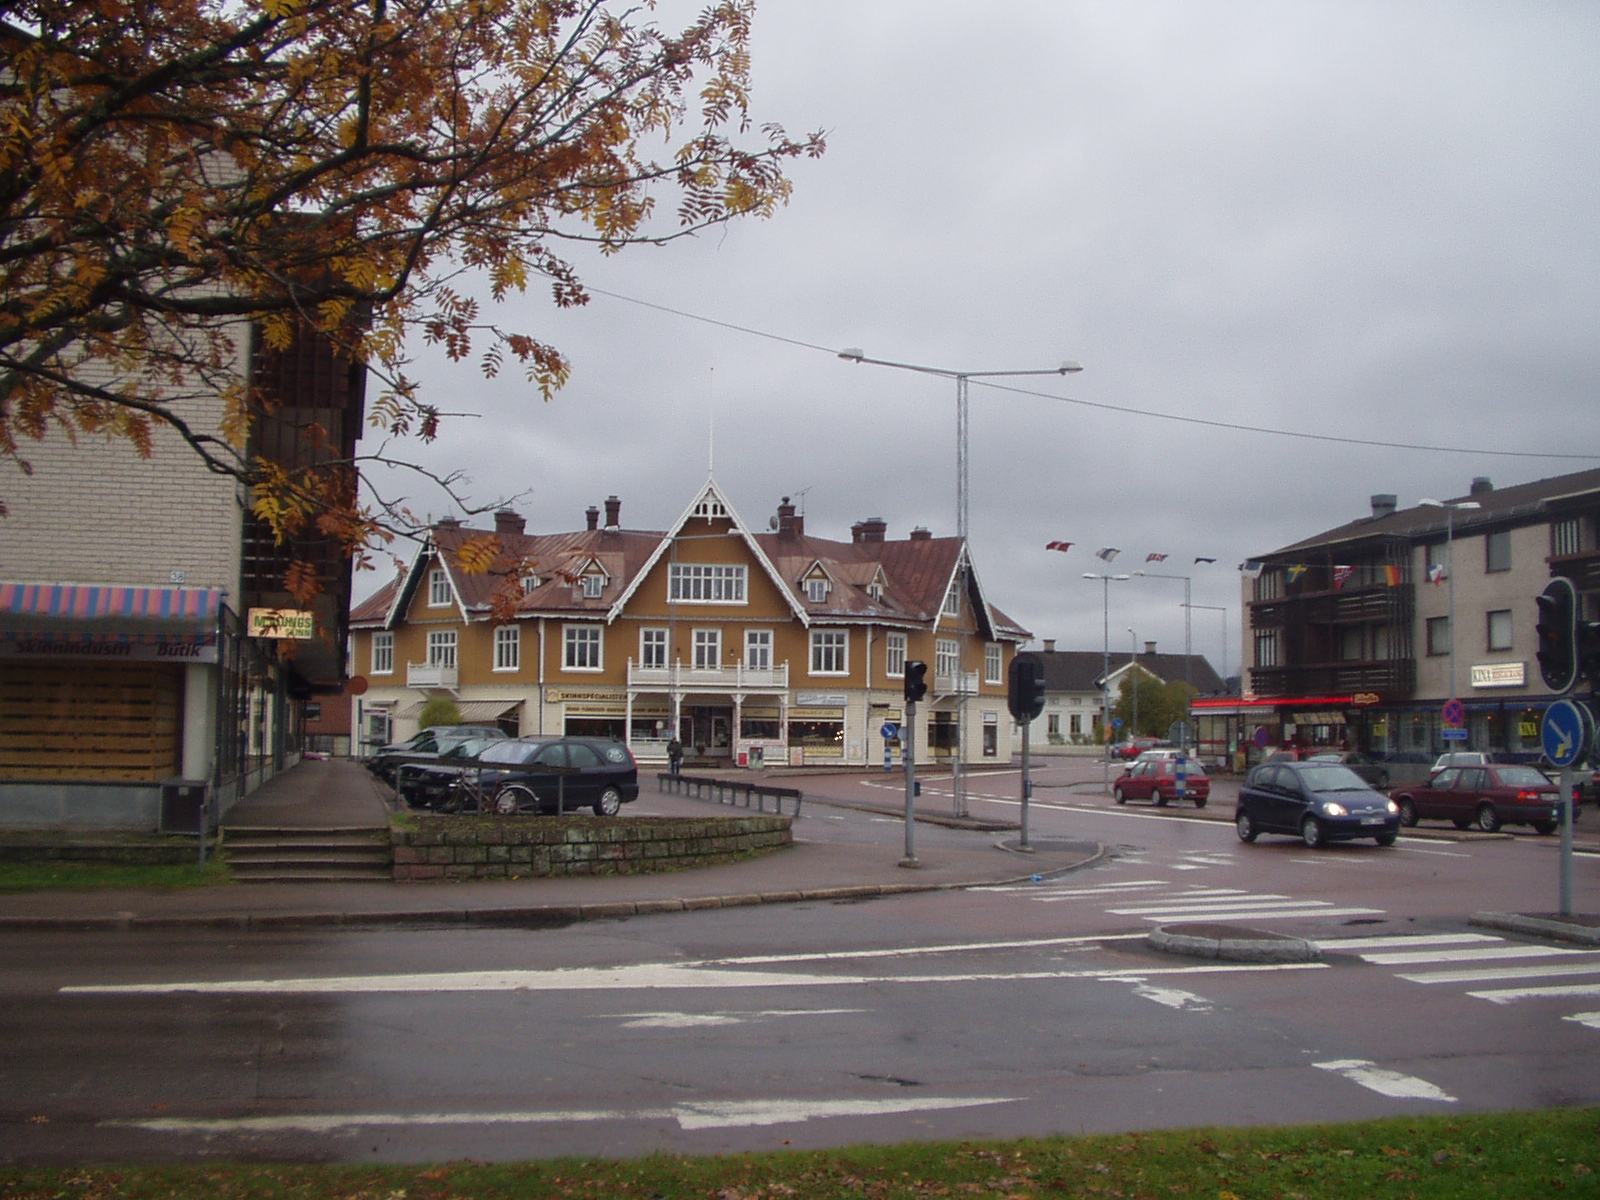
Sälen
Sälen [sæːlen] is a locality situated in Malung-Sälen Municipality, Dalarna County, Sweden with 652 inhabitants in 2010. the winter tens of thousands of tourists enter the area. Sälen is noted for hosting the start of Vasaloppet, the oldest (since 1..
Sälen Wikipedia Page


About Our Data
The data on this page is estimated using a number of publicly available tools and resources. It is provided without warranty, and could contain inaccuracies. Use at your own risk.