Categories in Vedum
Industries
Business Distribution by Industry in Vedum
| Industry Description | Number of Establishments | Average Age of Business | Average Google Rating |
|---|---|---|---|
| Shopping | 12 | 32 years | 4.2 |
| General contractors | 7 | — | 3.8 |
| Wholesale of machinery | 5 | 36 years | 4.1 |
Map of Vedum
Interactive Map
Vedum Population
Years 1975 to 2020
| Data | 1975 | 1990 | 2000 | 2015 | 2020 |
|---|---|---|---|---|---|
| Population | 1,853 | 1,475 | 1,093 | 777 | 806 |
| Population Density | 801.3 / km² | 637.8 / km² | 472.6 / km² | 336 / km² | 348.5 / km² |
Vedum Population change from 2000 to 2015
Decrease of 28.9% from year 2000 to 2015
| Location | Change since 1975 | Change since 1990 | Change since 2000 |
|---|---|---|---|
| Vedum | -58.1% | -47.3% | -28.9% |
| Västra Götaland County | +15.2% | +11.1% | +8.1% |
| Sweden | +19.2% | +14.2% | +10.2% |
Vedum Population Density
Population Density: 349 / km²
| Location | Population | Area | Density |
|---|---|---|---|
| Vedum | 806 | 2.313 km² | 349 / km² |
| Västra Götaland County | 1.6 million | 34,528 km² | 47.1 / km² |
| Sweden | 9.6 million | 449,151.6 km² | 21.3 / km² |
Vedum Historical and Projected Population
Estimated Population from 0 to 2100
- JRC (European Commission's Joint Research Centre) work on the GHS built-up grid
- CIESIN (Center for International Earth Science Information Network)
- [Link] Klein Goldewijk, K., Beusen, A., Doelman, J., and Stehfest, E.: Anthropogenic land use estimates for the Holocene – HYDE 3.2, Earth Syst. Sci. Data, 9, 927–953, https://doi.org/10.5194/essd-9-927-2017, 2017.
Area Codes
Percentage Area Codes used by businesses in Vedum
Postal Codes
Percentage of businesses by Postal Codes in Vedum
Human Development Index (HDI)
Statistic composite index of life expectancy, education, and per capita income.
Vedum CO2 Emissions
Carbon Dioxide (CO2) Emissions Per Capita in Tonnes Per Year
| Location | CO2 Emissions | CO2 Emissions Per Capita | CO2 Emissions Intensity |
|---|---|---|---|
| Vedum | 8,107 tn | 10.06 tn | 3,505.7 tons/km² |
| Västra Götaland County | 13,696,504 tn | 8.41 tn | 396.7 tons/km² |
| Sweden | 93,354,240 tn | 9.75 tn | 207.8 tons/km² |
| 2013 CO2 emissions (tonnes/year) | 8,107 tn |
| 2013 CO2 emissions (tonnes/year) per capita | 10.06 tn |
| 2013 CO2 emissions intensity (tonnes/km²/year) | 3,505.7 tons/km² |
Recent Nearby Earthquakes
Magnitude 3.0 and greater
| Date▼ | Time↕ | Magnitude↕ | Distance↕ | Depth↕ | Location↕ | Link |
|---|---|---|---|---|---|---|
| 7/29/15 | 7:46 PM | 3.4 | 75.9 km | 13,380 m | 7km WSW of Surte, Sweden | usgs.gov |
| 2/1/95 | 9:33 PM | 3.4 | 79.2 km | 10,000 m | Sweden | usgs.gov |
| 11/2/86 | 7:47 AM | 3.6 | 78.8 km | 10,000 m | Sweden | usgs.gov |
| 7/14/86 | 2:45 PM | 3.4 | 54.1 km | 10,000 m | Sweden | usgs.gov |
| 7/14/86 | 1:50 PM | 4.8 | 53.7 km | 10,000 m | Sweden | usgs.gov |
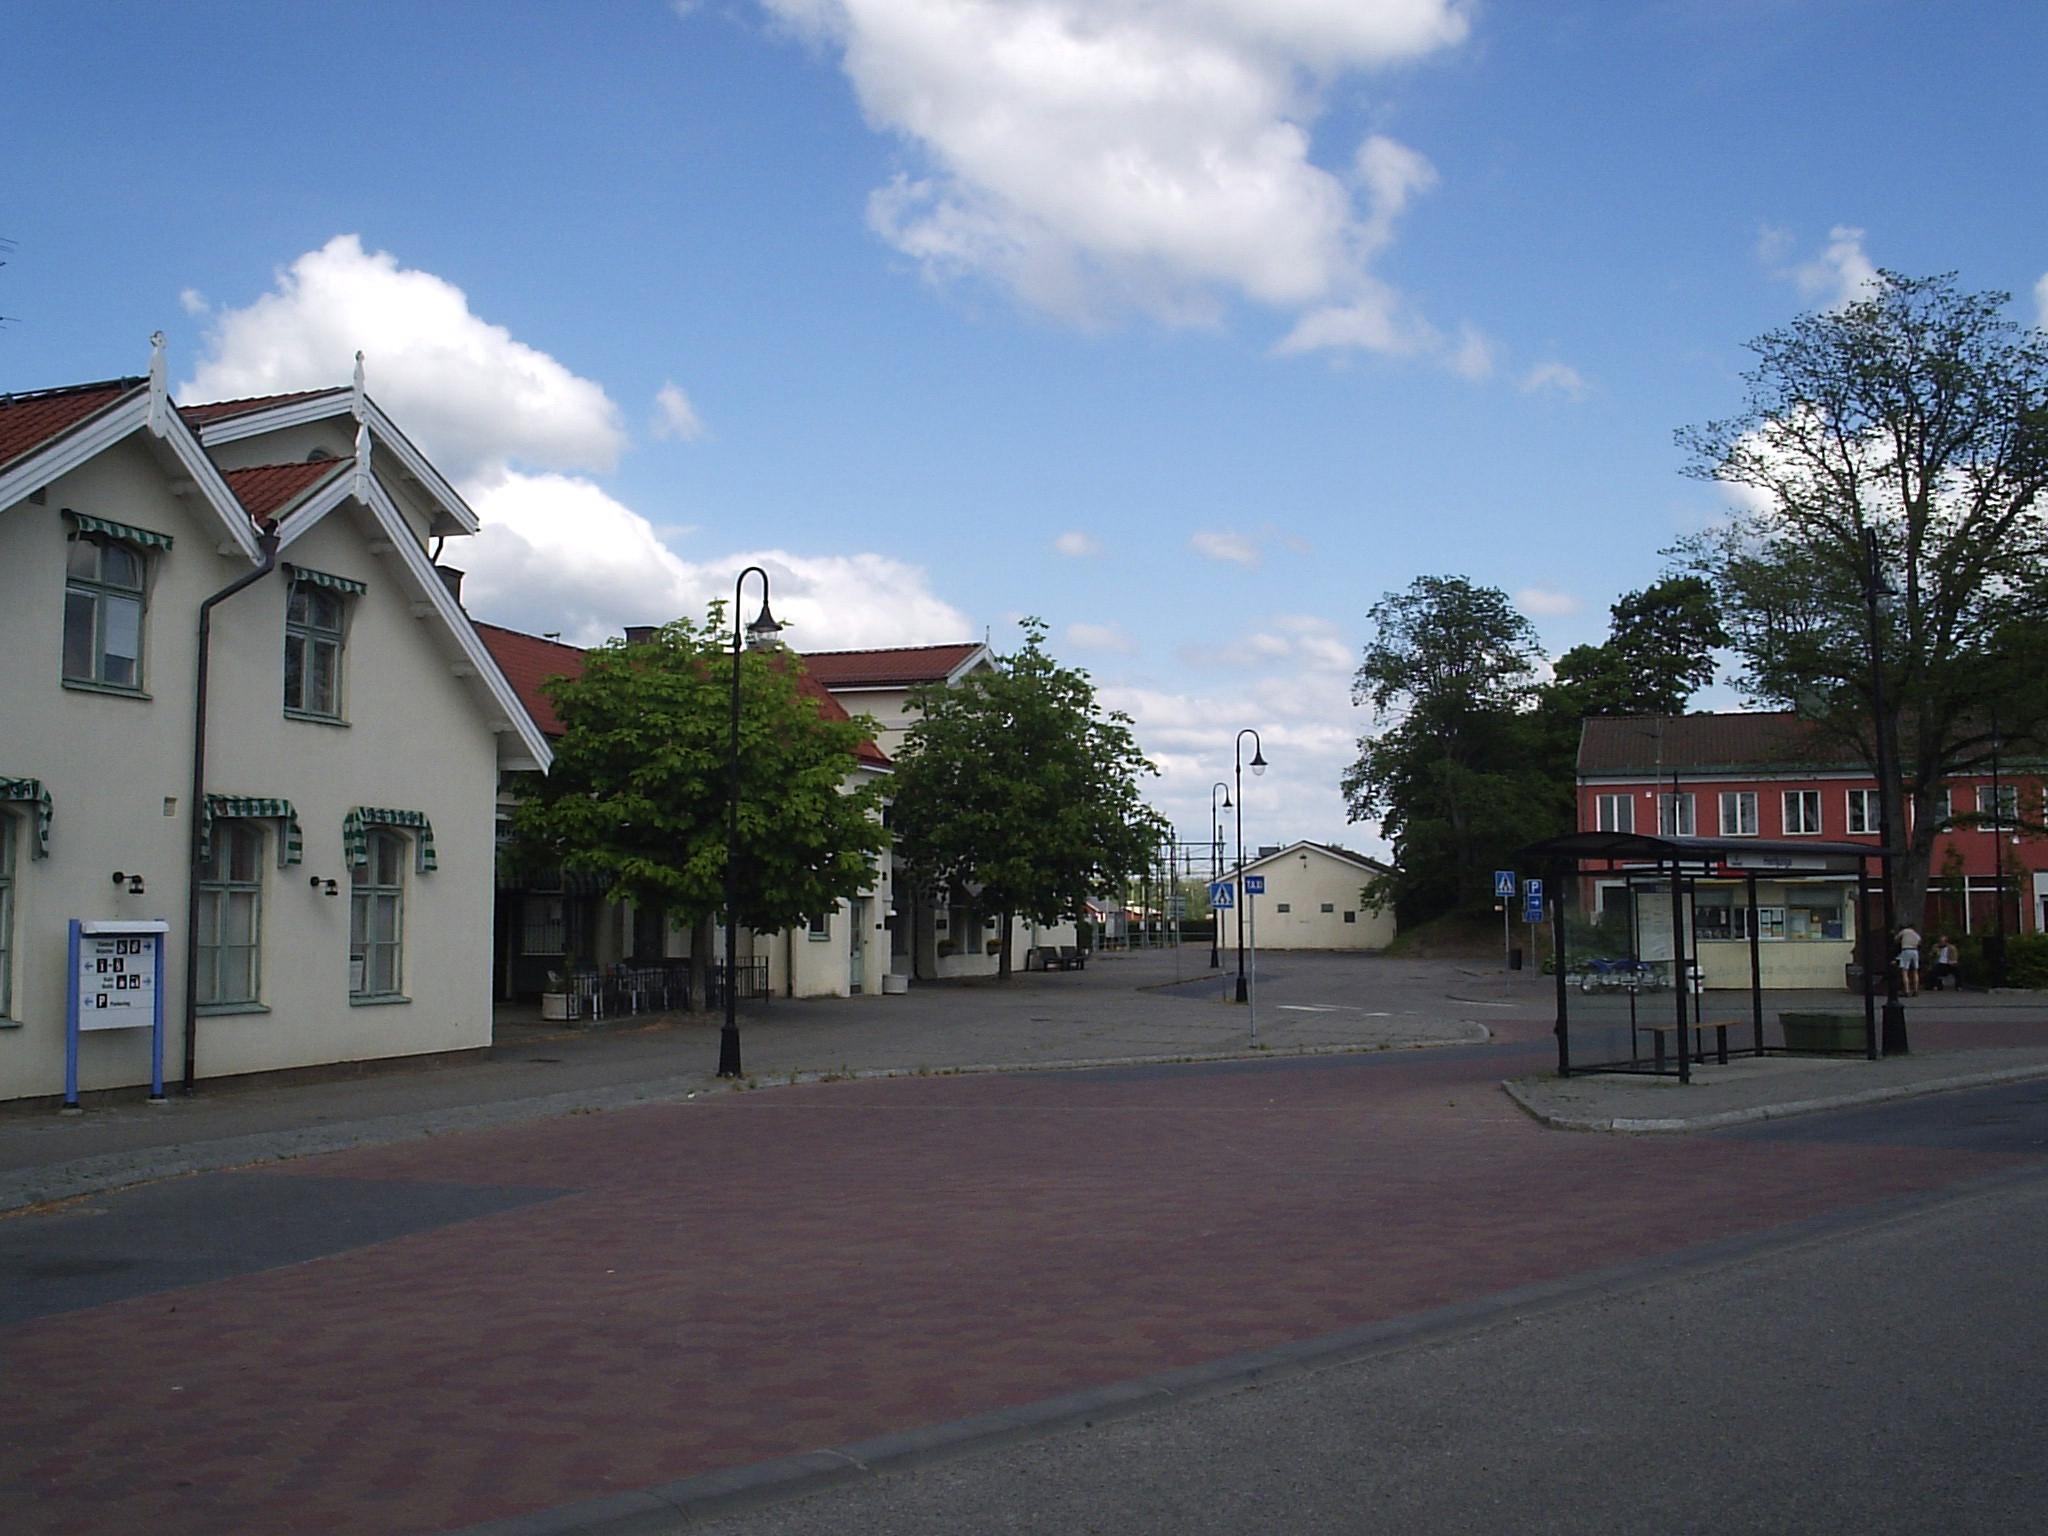
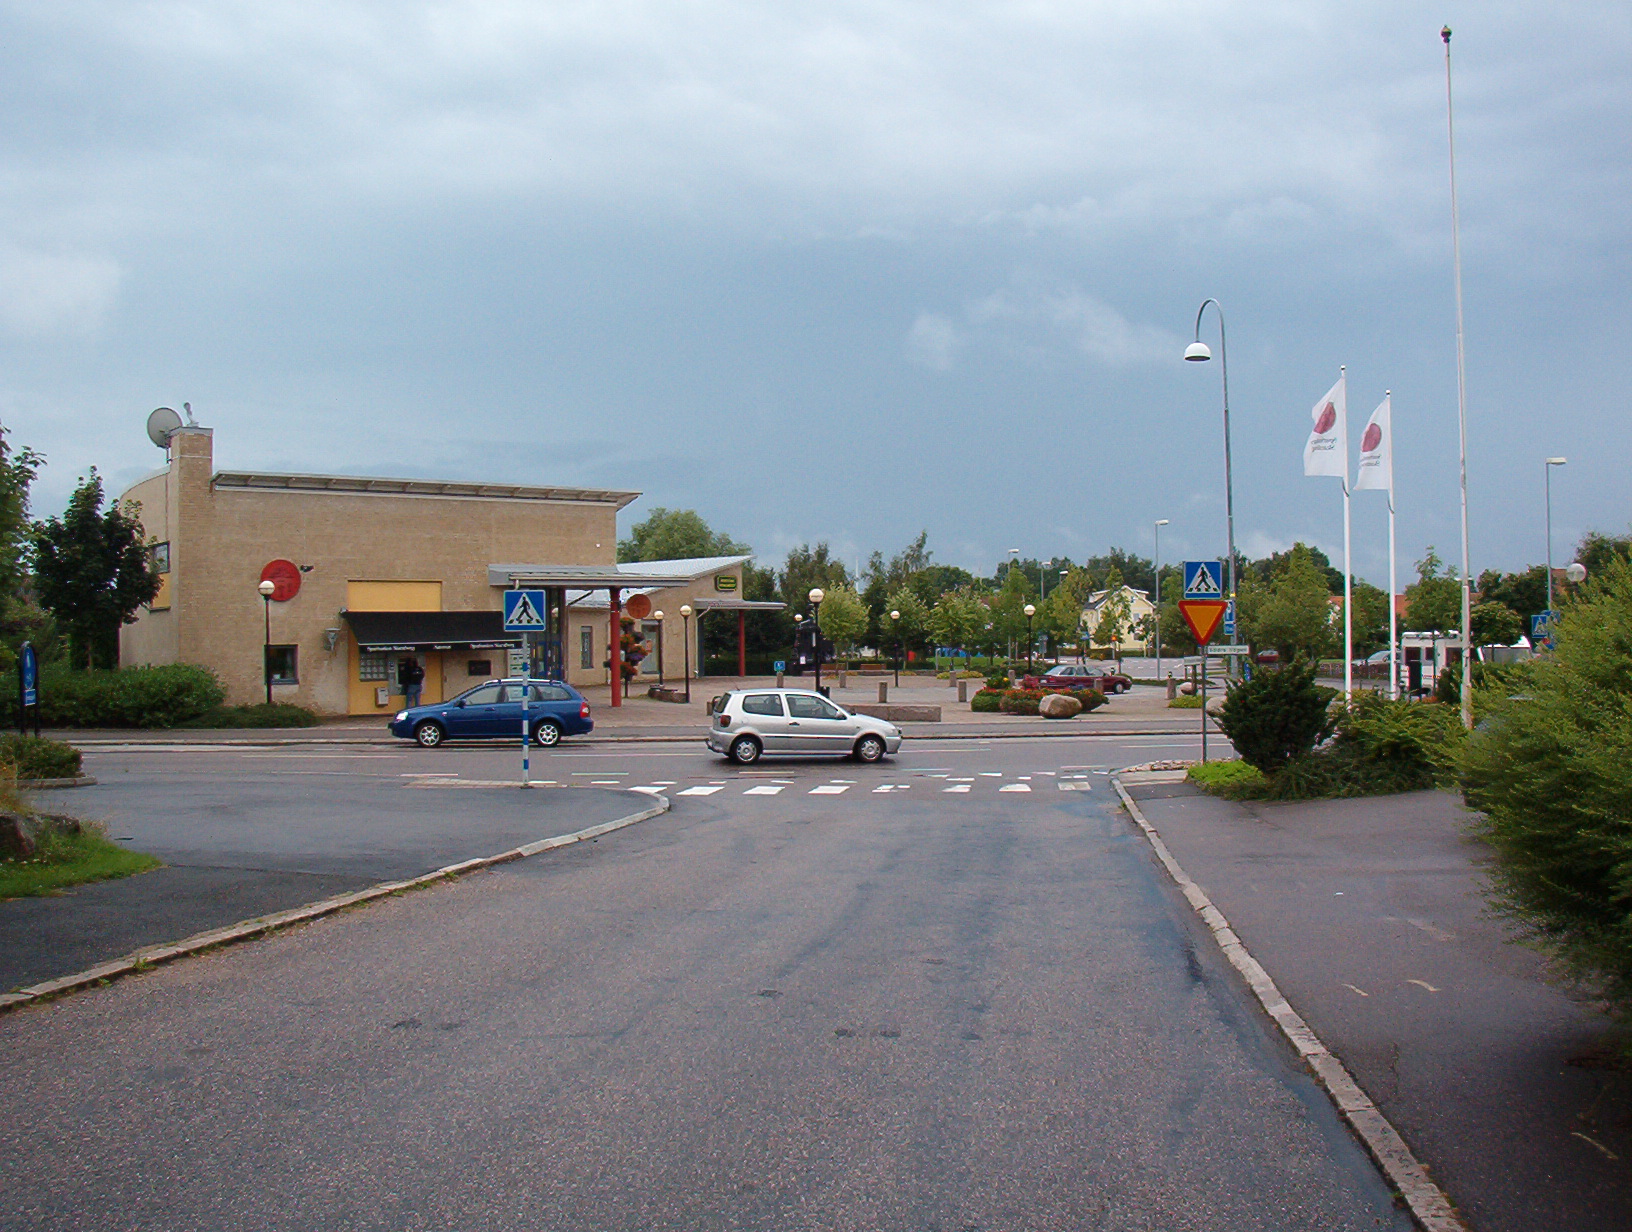
Vedum
Vedum is a locality situated in Vara Municipality, Västra Götaland County, Sweden with 926 inhabitants in 2010. company Vedum Kök och Bad AB, a manufacturer of kitchen and bathroom appliances, is located in Vedum. locality grew up around a station ..
Vedum Wikipedia Page
About Our Data
The data on this page is estimated using a number of publicly available tools and resources. It is provided without warranty, and could contain inaccuracies. Use at your own risk.