Categories in Vrigstad
Car Repair and MaintenanceGeneral Food ManufacturingIndustrial & Construction ManufacturingAssociation or OrganizationChurchesShipping CompanyContractorEngineerEngineering Consultancy OfficePreschoolGrocery stores and supermarketsRestaurantsBeauty aidsHair SalonBusiness Management ConsultantConsulting & Advisory ServicesReal Estate AgentsDepartment storesShopping otherHotels and motels
Industries
Business Distribution by Industry in Vrigstad
| Industry Description | Number of Establishments | Average Age of Business |
|---|---|---|
| Unreachable | 33 | 29 years |
| Wholesale of machinery | 25 | 31 years |
| Shopping other | 24 | 25 years |
| Farming | 15 | 27 years |
| Real estate | 12 | 37 years |
| Construction of buildings | 11 | 27 years |
| Restaurants | 11 | — |
| Education | 10 | — |
| Furniture stores | 9 | — |
| Shopping | 8 | — |
| Other membership organizations | 8 | 39 years |
| Hardware store | 6 | — |
| Corporate management | 6 | — |
| Technical construction services | 5 | 28 years |
| Freight/commercial transport | 5 | — |
| Electronics stores | 5 | — |
| Car repair | 5 | — |
| Wholesale of construction supplies | 5 | — |
Vrigstad Facts
| Area | 2.0 km² |
| Population | 1,294 |
| Population change (1975 to 2020) | -33.5% |
| Population change (2000 to 2020) | -10.6% |
| Neighborhoods | Nydala |
| Local Time | |
| Timezone | Central European Summer Time |
| Lat & Lng | 57.35000, 14.46667 |
Map of Vrigstad
Interactive Map
Vrigstad Population
Years 1975 to 2020
| Data | 1975 | 1990 | 2000 | 2015 | 2020 |
|---|---|---|---|---|---|
| Population | 1,947 | 1,620 | 1,447 | 1,250 | 1,294 |
| Population Density | 973.5 / km² | 810 / km² | 723.5 / km² | 625 / km² | 647 / km² |
Sources: JRC (European Commission's Joint Research Centre) work on the GHS built-up grid
Vrigstad Population change from 2000 to 2015
Decrease of 13.6% from year 2000 to 2015
| Location | Change since 1975 | Change since 1990 | Change since 2000 |
|---|---|---|---|
| Vrigstad | -35.8% | -22.8% | -13.6% |
| Jönköping County | +4.3% | +4.4% | +4.1% |
| Sweden | +19.2% | +14.2% | +10.2% |
Sources: JRC (European Commission's Joint Research Centre) work on the GHS built-up grid
Vrigstad Population Density
Population Density: 647 / km²
| Location | Population | Area | Density |
|---|---|---|---|
| Vrigstad | 1,294 | 2 km² | 647 / km² |
| Jönköping County | 342,162 | 11,745.5 km² | 29.1 / km² |
| Sweden | 9.6 million | 449,151.6 km² | 21.3 / km² |
Sources: JRC (European Commission's Joint Research Centre) work on the GHS built-up grid
Vrigstad Historical and Projected Population
Estimated Population from 0 to 2100
Sources:
- JRC (European Commission's Joint Research Centre) work on the GHS built-up grid
- CIESIN (Center for International Earth Science Information Network)
- [Link] Klein Goldewijk, K., Beusen, A., Doelman, J., and Stehfest, E.: Anthropogenic land use estimates for the Holocene – HYDE 3.2, Earth Syst. Sci. Data, 9, 927–953, https://doi.org/10.5194/essd-9-927-2017, 2017.
Area Codes
Percentage Area Codes used by businesses in Vrigstad
Price Distribution
Business distribution by price for Vrigstad
Human Development Index (HDI)
Statistic composite index of life expectancy, education, and per capita income.
Source: [Link] Kummu, M., Taka, M. &Guillaume, J. Gridded global datasets for Gross Domestic Product and Human Development Index over 1990–2015. Sci Data 5, 180004 (2018) doi:10.1038/sdata.2018.4
Vrigstad CO2 Emissions
Carbon Dioxide (CO2) Emissions Per Capita in Tonnes Per Year
| Location | CO2 Emissions | CO2 Emissions Per Capita | CO2 Emissions Intensity |
|---|---|---|---|
| Vrigstad | 12,802 tn | 9.89 tn | 6,400.8 tons/km² |
| Jönköping County | 3,383,180 tn | 9.89 tn | 288 tons/km² |
| Sweden | 93,354,240 tn | 9.75 tn | 207.8 tons/km² |
Sources: [Link] Moran, D., Kanemoto K; Jiborn, M., Wood, R., Többen, J., and Seto, K.C. (2018) Carbon footprints of 13,000 cities. Environmental Research Letters DOI: 10.1088/1748-9326/aac72a
Vrigstad CO2 Emissions
| 2013 CO2 emissions (tonnes/year) | 12,802 tn |
| 2013 CO2 emissions (tonnes/year) per capita | 9.89 tn |
| 2013 CO2 emissions intensity (tonnes/km²/year) | 6,400.8 tons/km² |
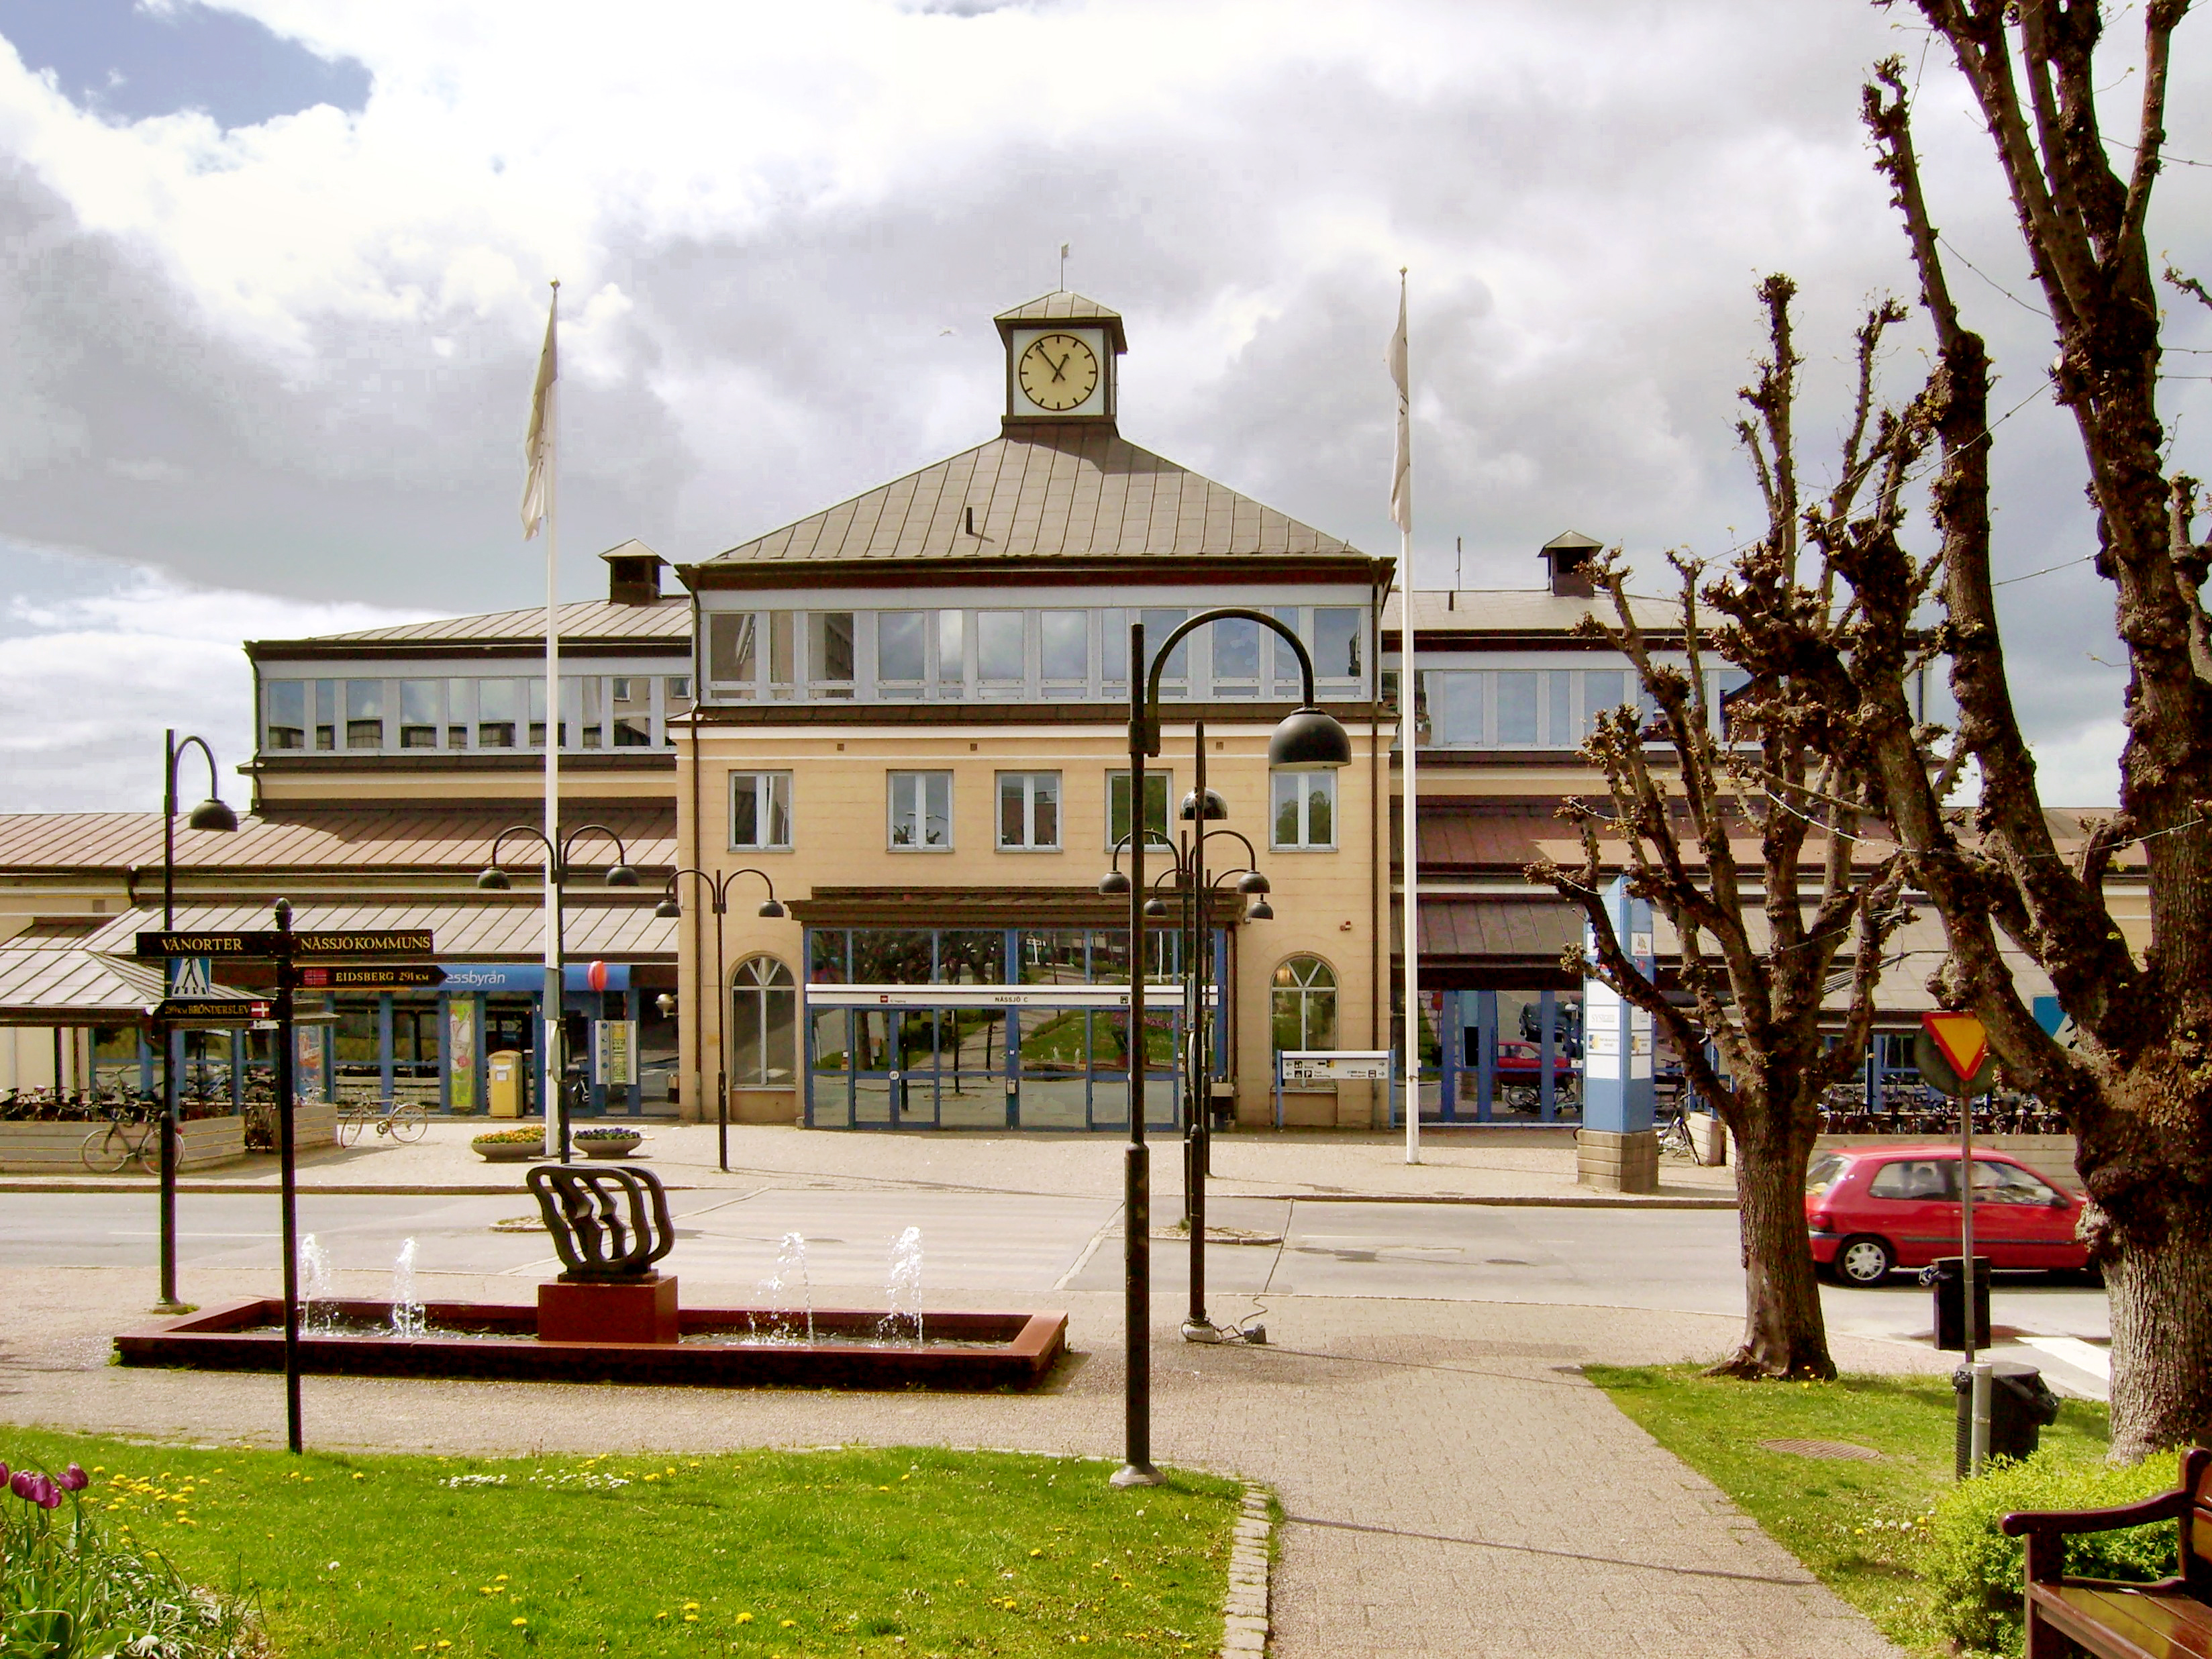
Vrigstad
Vrigstad is a locality situated in Sävsjö Municipality, Jönköping County, Sweden with 1,421 inhabitants in 2010.
Vrigstad Wikipedia Page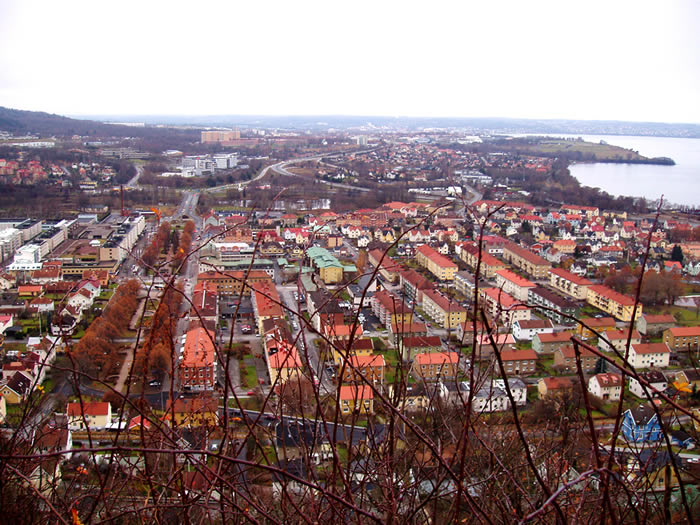

About Our Data
The data on this page is estimated using a number of publicly available tools and resources. It is provided without warranty, and could contain inaccuracies. Use at your own risk.