Categories in Selice
Selice Facts
| Area | 2.1 km² |
| Population | 2,300 |
| Male Population | 1,134 (49.3%) |
| Female Population | 1,166 (50.7%) |
| Population change (1975 to 2020) | +13.4% |
| Population change (2000 to 2020) | -1.6% |
| Median Age | 37.4 years (Male: 35.5, Female: 39.1) |
| Neighborhoods | Dvory |
| Local Time | |
| Timezone | Central European Summer Time |
| Lat & Lng | 48.09584, 17.96430 |
| Postal Codes | 925 72 |
Map of Selice
Interactive Map
Selice Population
Years 1975 to 2020
| Data | 1975 | 1990 | 2000 | 2015 | 2020 |
|---|---|---|---|---|---|
| Population | 2,028 | 2,328 | 2,337 | 2,321 | 2,300 |
| Population Density | 983.3 / km² | 1,128.7 / km² | 1,133.1 / km² | 1,125.3 / km² | 1,115.2 / km² |
Selice Population change from 2000 to 2015
Decrease of 0.7% from year 2000 to 2015
| Location | Change since 1975 | Change since 1990 | Change since 2000 |
|---|---|---|---|
| Selice | +14.4% | -0.3% | -0.7% |
| Nitra Region | -1.9% | -7.2% | -5.5% |
| Slovakia | +14.3% | +2.8% | +0.7% |
Selice Median Age
Median Age: 37.4 years
| Location | Median Age | Median Age (Female) | Median Age (Male) |
|---|---|---|---|
| Selice | 37.4 yrs | 39.1 yrs | 35.5 yrs |
| Nitra Region | 39.4 yrs | 41.5 yrs | 37.6 yrs |
| Slovakia | 37.7 yrs | 39.3 yrs | 36.1 yrs |
Selice Population Density
Population Density: 1,115 / km²
| Location | Population | Area | Density |
|---|---|---|---|
| Selice | 2,300 | 2.063 km² | 1,115 / km² |
| Nitra Region | 681,795 | 6,342.6 km² | 108 / km² |
| Slovakia | 5.4 million | 48,996.2 km² | 111 / km² |
Selice Historical and Projected Population
Estimated Population from 0 to 2100
- JRC (European Commission's Joint Research Centre) work on the GHS built-up grid
- CIESIN (Center for International Earth Science Information Network)
- [Link] Klein Goldewijk, K., Beusen, A., Doelman, J., and Stehfest, E.: Anthropogenic land use estimates for the Holocene – HYDE 3.2, Earth Syst. Sci. Data, 9, 927–953, https://doi.org/10.5194/essd-9-927-2017, 2017.
Human Development Index (HDI)
Statistic composite index of life expectancy, education, and per capita income.
Selice CO2 Emissions
Carbon Dioxide (CO2) Emissions Per Capita in Tonnes Per Year
| Location | CO2 Emissions | CO2 Emissions Per Capita | CO2 Emissions Intensity |
|---|---|---|---|
| Selice | 24,311 tn | 10.57 tn | 11,787 tons/km² |
| Nitra Region | 7,185,384 tn | 10.54 tn | 1,132.9 tons/km² |
| Slovakia | 56,497,175 tn | 10.42 tn | 1,153.1 tons/km² |
| 2013 CO2 emissions (tonnes/year) | 24,311 tn |
| 2013 CO2 emissions (tonnes/year) per capita | 10.57 tn |
| 2013 CO2 emissions intensity (tonnes/km²/year) | 11,787 tons/km² |
Natural Hazards Risk
Relative risk out of 10
| Hazard | Risk Level |
|---|---|
| Flood | Medium (4) |
| Earthquake | Medium (4) |
* Risk, particularly concerning flood or landslide, may not be for the entire area.
- Dilley, M., R.S. Chen, U. Deichmann, A.L. Lerner-Lam, M. Arnold, J. Agwe, P. Buys, O. Kjekstad, B. Lyon, and G. Yetman. 2005. Natural Disaster Hotspots: A Global Risk Analysis. Washington, D.C.: World Bank. https://doi.org/10.1596/0-8213-5930-4.
- Center for Hazards and Risk Research - CHRR - Columbia University, Center for International Earth Science Information Network - CIESIN - Columbia University. 2005. Global Flood Hazard Frequency and Distribution. Palisades, NY: NASA Socioeconomic Data and Applications Center (SEDAC). https://doi.org/10.7927/H4668B3D.
- Center for Hazards and Risk Research - CHRR - Columbia University, Center for International Earth Science Information Network - CIESIN - Columbia University. 2005. Global Earthquake Hazard Distribution - Peak Ground Acceleration. Palisades, NY: NASA Socioeconomic Data and Applications Center (SEDAC). https://doi.org/10.7927/H4BZ63ZS.
Recent Nearby Earthquakes
Magnitude 3.0 and greater
| Date▼ | Time↕ | Magnitude↕ | Distance↕ | Depth↕ | Location↕ | Link |
|---|---|---|---|---|---|---|
| 6/5/13 | 6:45 PM | 4.1 | 95.9 km | 6,200 m | 4km ENE of Ersekvadkert, Hungary | usgs.gov |
| 1/29/11 | 5:41 PM | 4.3 | 69.1 km | 10,000 m | Hungary | usgs.gov |
| 3/13/06 | 8:28 AM | 3.6 | 46.9 km | 10,000 m | Slovakia | usgs.gov |
| 3/9/06 | 8:14 PM | 3.1 | 88.7 km | 5,000 m | Slovakia | usgs.gov |
| 5/16/05 | 1:39 PM | 3.2 | 97.9 km | 8,800 m | Hungary | usgs.gov |
| 10/14/04 | 9:44 AM | 3 | 60.8 km | 8,300 m | Hungary | usgs.gov |
| 9/23/04 | 5:32 AM | 3.5 | 65.8 km | 7,500 m | Slovakia | usgs.gov |
| 8/18/04 | 9:01 AM | 3.3 | 52.1 km | 10,000 m | Hungary | usgs.gov |
| 8/17/04 | 6:00 PM | 3.4 | 57.8 km | 10,000 m | Hungary | usgs.gov |
| 5/25/04 | 7:30 AM | 4.1 | 95.4 km | 9,600 m | Hungary | usgs.gov |
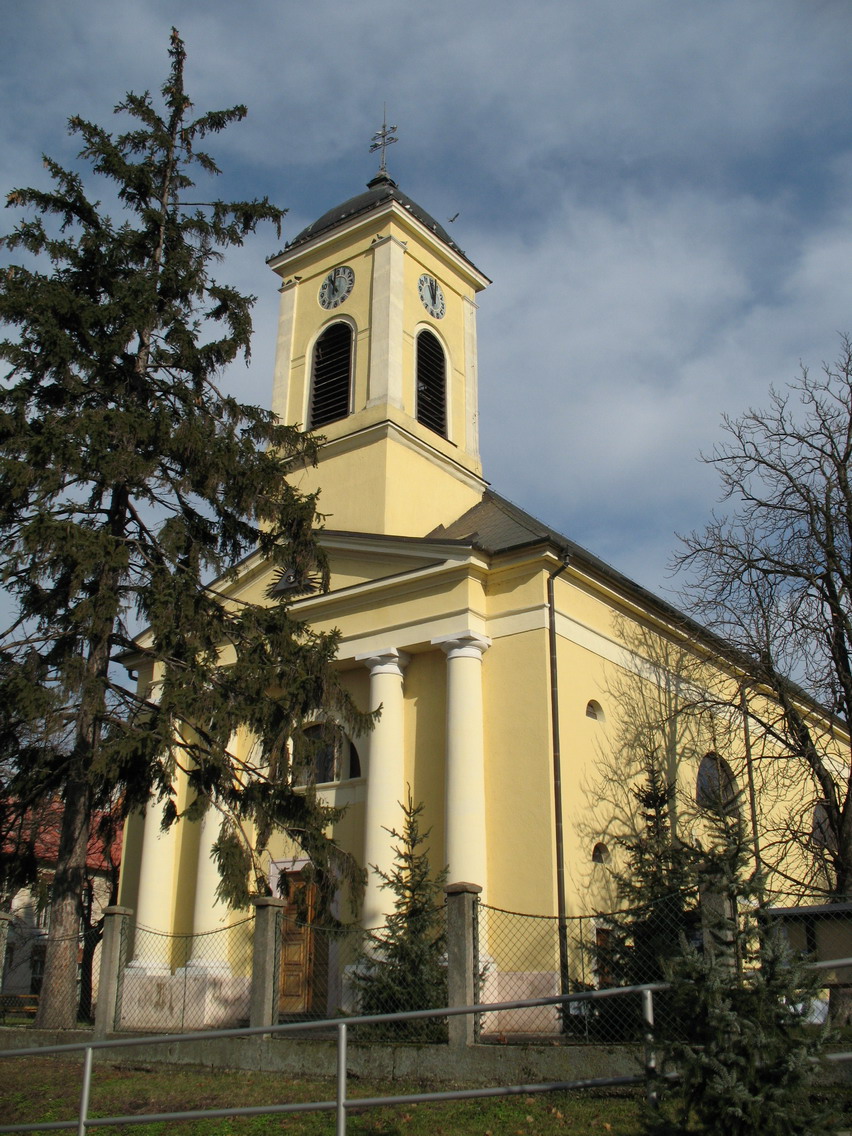
Selice
Selice (in Slovak; Seleuch in German, Sókszelőce in Hungarian, Šókselécéňa or Šóka in Romani) is a village and municipality in Šaľa District, in the Nitra Region of south-west Slovakia.
Selice Wikipedia Page

About Our Data
The data on this page is estimated using a number of publicly available tools and resources. It is provided without warranty, and could contain inaccuracies. Use at your own risk.