Nahulingo Facts
| Area | 28.3 km² |
| Population | 10,441 |
| Male Population | 5,117 (49.0%) |
| Female Population | 5,324 (51.0%) |
| Population change (1975 to 2020) | +65.5% |
| Population change (2000 to 2020) | +12.5% |
| Median Age | 22.2 years (Male: 20.6, Female: 23.6) |
| GDP per capita (PPP) | $7,881 (2022) |
| Local Time | |
| Timezone | Central Standard Time |
| Lat & Lng | 13.70361, -89.71278 |
Map of Nahulingo
Interactive Map
Nahulingo Population
Years 1975 to 2030
| Data | 1975 | 1990 | 2000 | 2015 | 2020 | 2025* | 2030* |
|---|---|---|---|---|---|---|---|
| Population | 6,307 | 8,908 | 9,280 | 9,058 | 10,441 | 10,715 | 11,176 |
| Population Density | 222.8 / km² | 314.6 / km² | 327.8 / km² | 319.9 / km² | 368.8 / km² | 378.5 / km² | 394.7 / km² |
* Projected
Sources: JRC (European Commission's Joint Research Centre) work on the GHS built-up gridNahulingo Population change from 2000 to 2020
Increase of 12.5% from year 2000 to 2020
| Location | Change since 1975 | Change since 1990 | Change since 2000 |
|---|---|---|---|
| Nahulingo | +65.5% | +17.2% | +12.5% |
| Sonsonate Department | — | — | — |
| El Salvador | — | — | — |
Sources: JRC (European Commission's Joint Research Centre) work on the GHS built-up grid
Nahulingo Median Age
Median Age: 22.2 years
| Location | Median Age | Median Age (Female) | Median Age (Male) |
|---|---|---|---|
| Nahulingo | 22.2 yrs | 23.6 yrs | 20.6 yrs |
| Sonsonate Department | 22.2 yrs | 23.4 yrs | 20.9 yrs |
| El Salvador | 23.3 yrs | 24.9 yrs | 21.5 yrs |
Sources: CIESIN (Center for International Earth Science Information Network)
Nahulingo Population Density
Population Density: 369 / km²
| Location | Population | Area | Density |
|---|---|---|---|
| Nahulingo | 10,441 | 28.3 km² | 369 / km² |
| Sonsonate Department | 481,925 | 1,246.5 km² | 387 / km² |
| El Salvador | 6.1 million | 20,749.8 km² | 295 / km² |
Sources: JRC (European Commission's Joint Research Centre) work on the GHS built-up grid
Nahulingo Historical and Projected Population
Estimated Population from 1800 to 2100
Sources:
- JRC (European Commission's Joint Research Centre) work on the GHS built-up grid
- CIESIN (Center for International Earth Science Information Network)
- [Link] Klein Goldewijk, K., Beusen, A., Doelman, J., and Stehfest, E.: Anthropogenic land use estimates for the Holocene – HYDE 3.2, Earth Syst. Sci. Data, 9, 927–953, https://doi.org/10.5194/essd-9-927-2017, 2017.
Human Development Index (HDI)
Statistic composite index of life expectancy, education, and per capita income.
Source: [Link] Kummu, M., Taka, M. &Guillaume, J. Gridded global datasets for Gross Domestic Product and Human Development Index over 1990–2015. Sci Data 5, 180004 (2018) doi:10.1038/sdata.2018.4
Nahulingo Gross Domestic Product (GDP)
GDP per capita, PPP (constant 2017 international $)
| Data | 1990 | 1995 | 2000 | 2005 | 2010 | 2015 | 2020 | 2022 |
|---|---|---|---|---|---|---|---|---|
| GDP per capita | $3,875 | $5,116 | $5,663 | $4,738 | $5,572 | $7,116 | $6,899 | $7,881 |
| Total GDP | $593.9M | $858.5M | $1B | $866.2M | $1B | $1.4B | $1.4B | $1.6B |
Source: [Link] Kummu, M., Kosonen, M. & Masoumzadeh Sayyar, S. Downscaled gridded global dataset for gross domestic product (GDP) per capita PPP over 1990–2022. Sci Data 12, 178 (2025) doi:10.1038/s41597-025-04487-x
Nahulingo CO2 Emissions
Carbon Dioxide (CO2) Emissions Per Capita in Tonnes Per Year
| Location | CO2 Emissions | CO2 Emissions Per Capita | CO2 Emissions Intensity |
|---|---|---|---|
| Nahulingo | 17,177 tn | 1.65 tn | 606.7 tons/km² |
| Sonsonate Department | 803,669 tn | 1.67 tn | 644.7 tons/km² |
| El Salvador | 10,116,208 tn | 1.65 tn | 487.5 tons/km² |
Sources: [Link] Moran, D., Kanemoto K; Jiborn, M., Wood, R., Többen, J., and Seto, K.C. (2018) Carbon footprints of 13,000 cities. Environmental Research Letters DOI: 10.1088/1748-9326/aac72a
Nahulingo CO2 Emissions
| 2013 CO2 emissions (tonnes/year) | 17,177 tn |
| 2013 CO2 emissions (tonnes/year) per capita | 1.65 tn |
| 2013 CO2 emissions intensity (tonnes/km²/year) | 606.7 tons/km² |
Natural Hazards Risk
Relative risk out of 10
| Hazard | Risk Level |
|---|---|
| Flood | High (9) |
| Earthquake | High (8) |
| Landslide | Medium (6) |
| Volcano | High (10) |
* Risk, particularly concerning flood or landslide, may not be for the entire area.
Sources:
- Dilley, M., R.S. Chen, U. Deichmann, A.L. Lerner-Lam, M. Arnold, J. Agwe, P. Buys, O. Kjekstad, B. Lyon, and G. Yetman. 2005. Natural Disaster Hotspots: A Global Risk Analysis. Washington, D.C.: World Bank. https://doi.org/10.1596/0-8213-5930-4.
- Center for Hazards and Risk Research - CHRR - Columbia University, Center for International Earth Science Information Network - CIESIN - Columbia University, and Norwegian Geotechnical Institute - NGI. 2005. Global Landslide Hazard Distribution. Palisades, NY: NASA Socioeconomic Data and Applications Center (SEDAC). https://doi.org/10.7927/H4P848VZ.
- Center for Hazards and Risk Research - CHRR - Columbia University, Center for International Earth Science Information Network - CIESIN - Columbia University. 2005. Global Flood Hazard Frequency and Distribution. Palisades, NY: NASA Socioeconomic Data and Applications Center (SEDAC). https://doi.org/10.7927/H4668B3D.
- Center for Hazards and Risk Research - CHRR - Columbia University, Center for International Earth Science Information Network - CIESIN - Columbia University. 2005. Global Volcano Hazard Frequency and Distribution. Palisades, NY: NASA Socioeconomic Data and Applications Center (SEDAC). https://doi.org/10.7927/H4BR8Q45.
- Center for Hazards and Risk Research - CHRR - Columbia University, Center for International Earth Science Information Network - CIESIN - Columbia University. 2005. Global Earthquake Hazard Distribution - Peak Ground Acceleration. Palisades, NY: NASA Socioeconomic Data and Applications Center (SEDAC). https://doi.org/10.7927/H4BZ63ZS.
Recent Nearby Earthquakes
Magnitude 3.0 and greater
| Date▼ | Time↕ | Magnitude↕ | Distance↕ | Depth↕ | Location↕ | Link |
|---|---|---|---|---|---|---|
| 5/25/19 | 10:00 PM | 4 | 33 km | 90,380 m | 15km WNW of La Libertad, El Salvador | usgs.gov |
| 4/14/19 | 3:32 AM | 4.3 | 32 km | 102,290 m | 15km S of San Francisco Menendez, El Salvador | usgs.gov |
| 2/21/19 | 8:52 AM | 4.1 | 27.5 km | 57,550 m | 19km SE of Acajutla, El Salvador | usgs.gov |
| 12/28/18 | 12:49 AM | 4.3 | 29.2 km | 76,500 m | 12km SSW of Acajutla, El Salvador | usgs.gov |
| 11/9/18 | 2:22 PM | 3.6 | 23.9 km | 10,000 m | 7km SSE of Atiquizaya, El Salvador | usgs.gov |
| 1/12/18 | 10:11 PM | 4.8 | 25.2 km | 118,800 m | 4km N of Armenia, El Salvador | usgs.gov |
| 7/12/17 | 10:08 AM | 4.6 | 35.4 km | 68,870 m | 21km S of Acajutla, El Salvador | usgs.gov |
| 7/23/16 | 8:19 AM | 4.1 | 23.5 km | 60,250 m | 19km SE of Acajutla, El Salvador | usgs.gov |
| 6/15/16 | 9:06 AM | 4 | 18.2 km | 77,260 m | 4km SE of Acajutla, El Salvador | usgs.gov |
| 1/17/16 | 7:58 AM | 4 | 19.9 km | 53,370 m | 18km ESE of Acajutla, El Salvador | usgs.gov |
Source: U.S. Geological Survey (USGS)
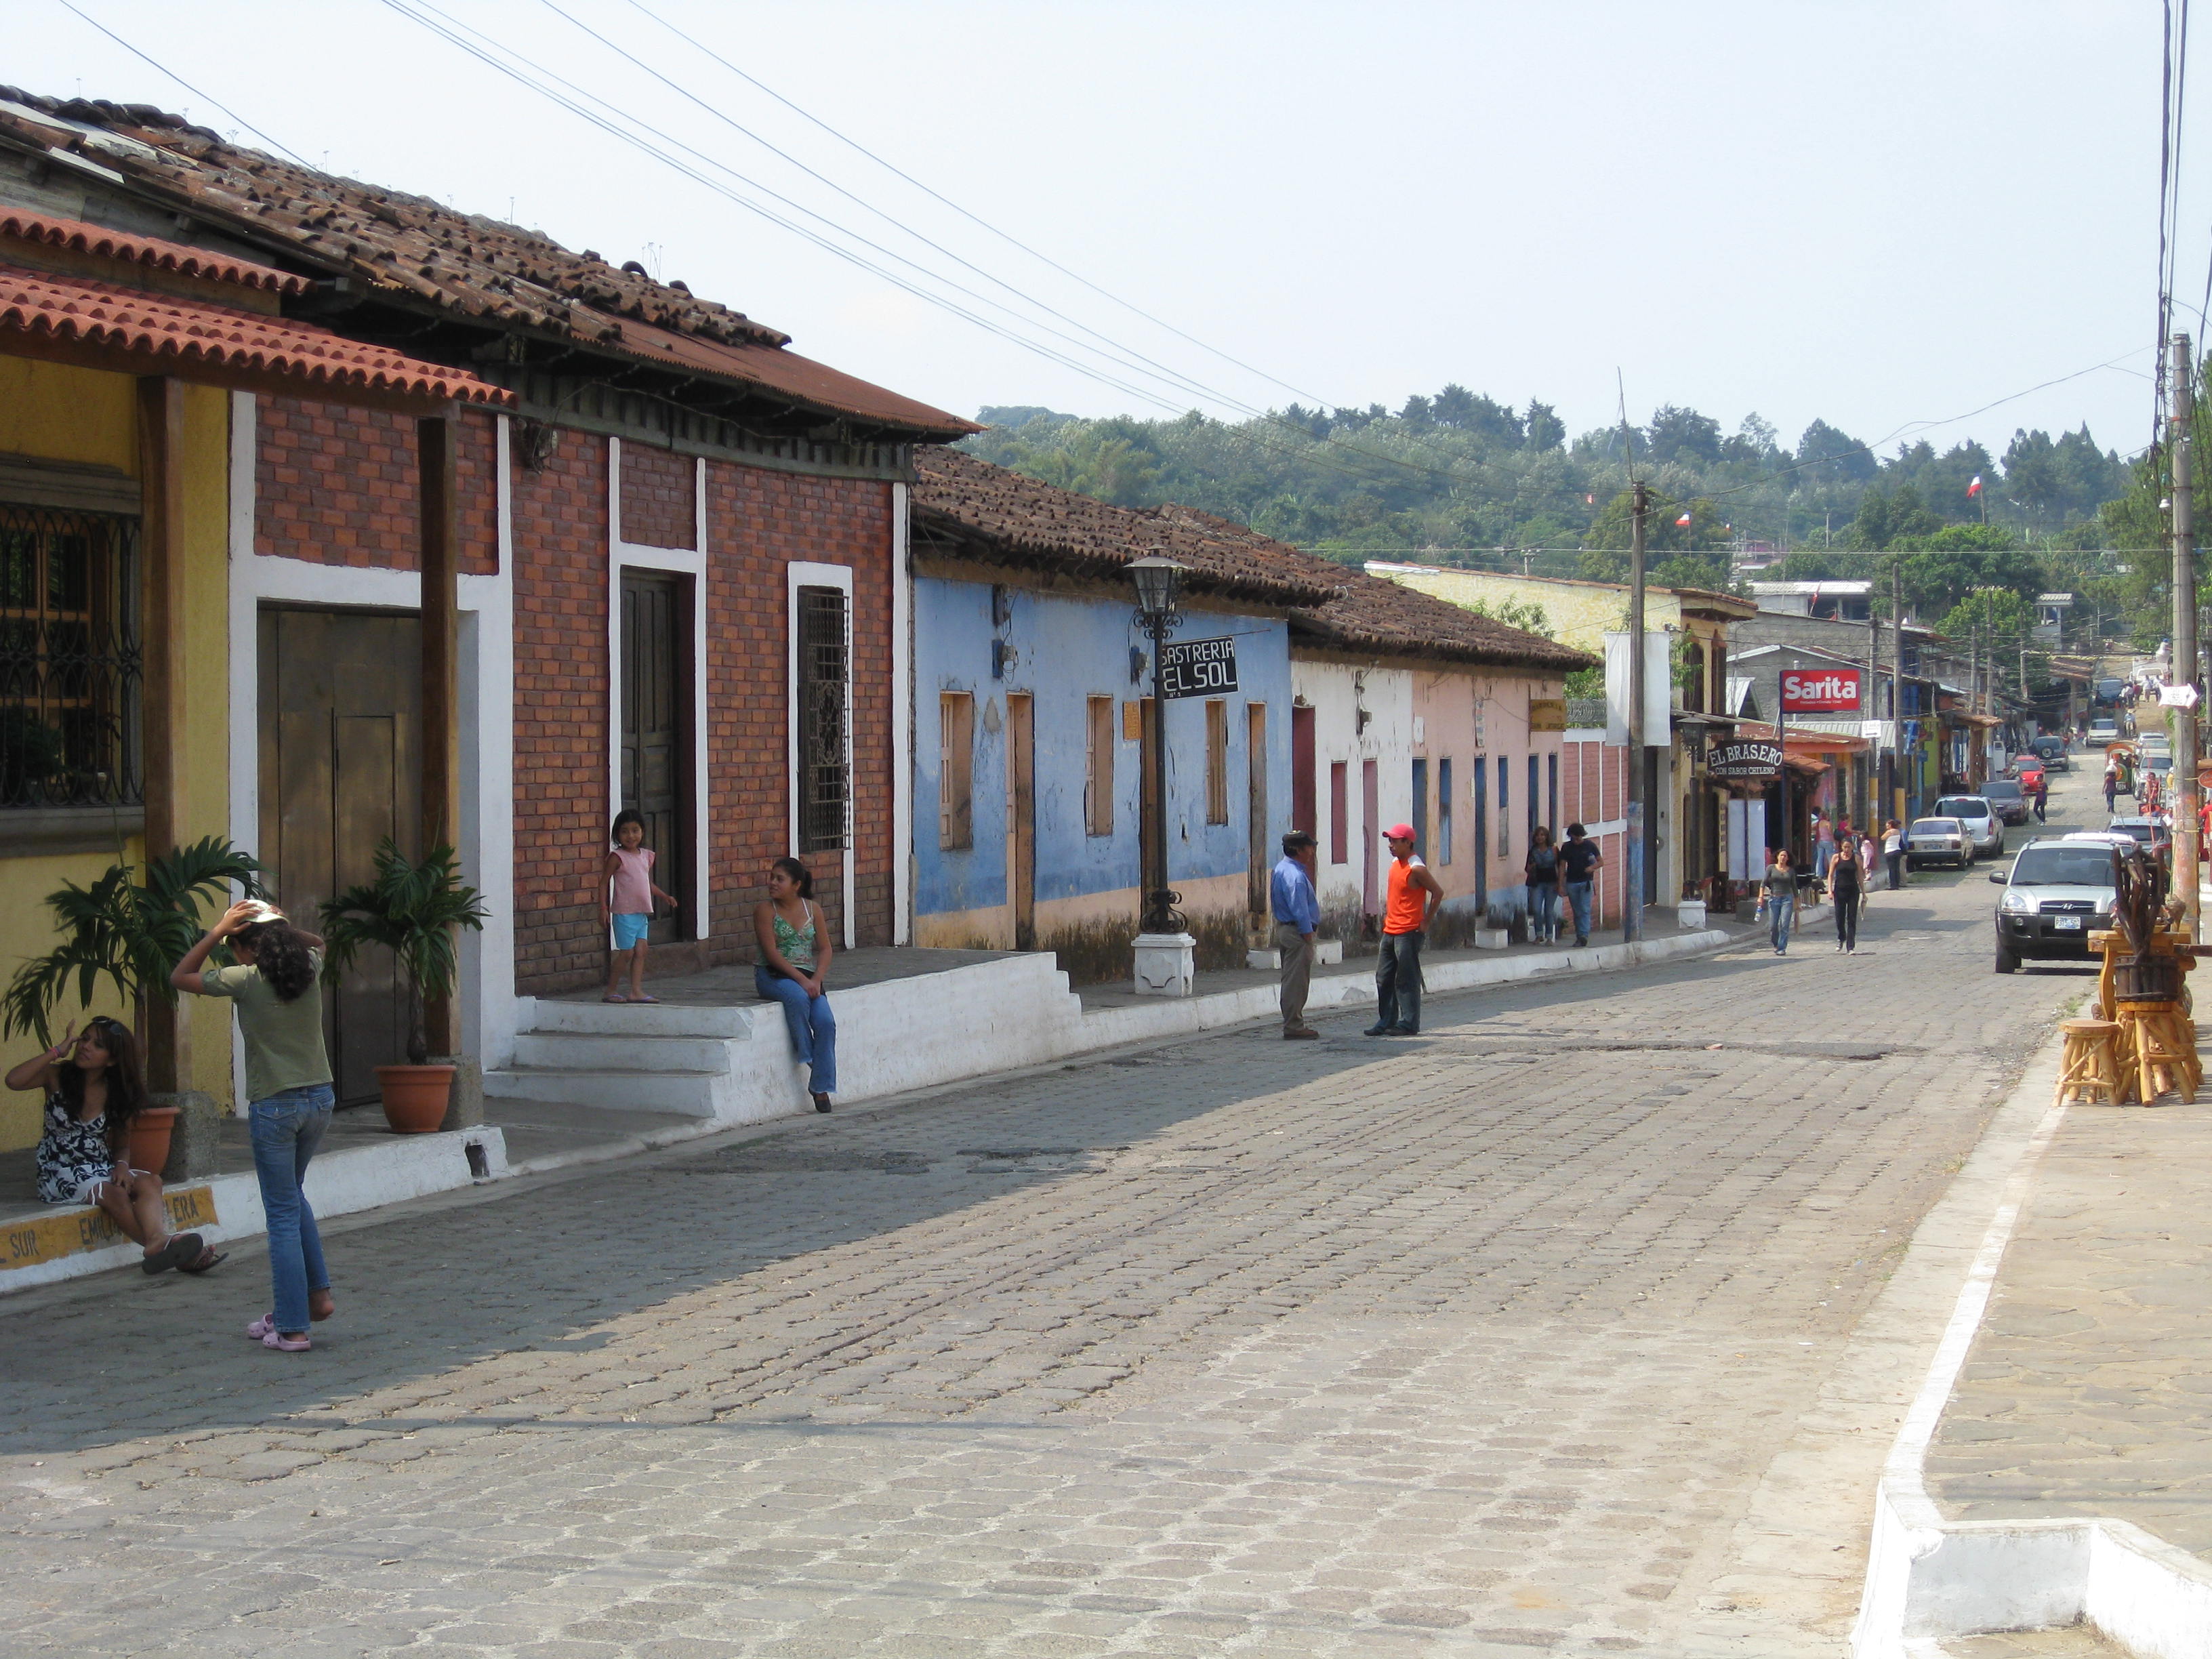
Nahulingo
Nahulingo is a municipality in the Sonsonate department of El Salvador.
Nahulingo Wikipedia Page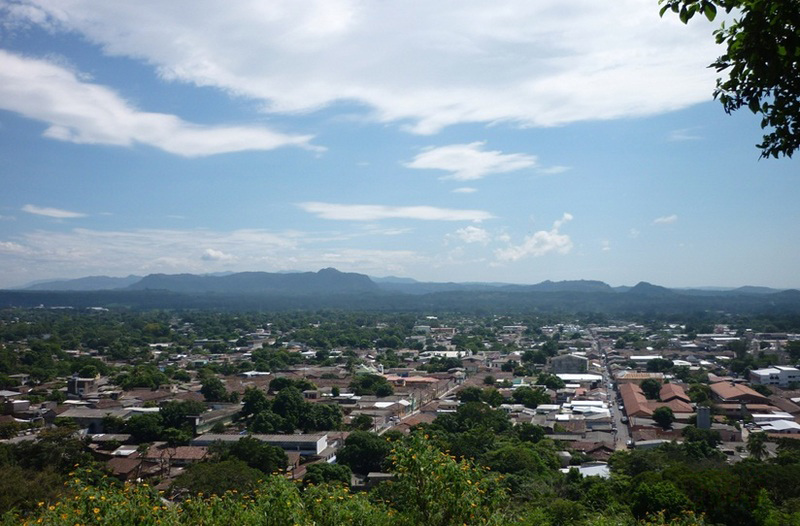

About Our Data
The data on this page is estimated using a number of publicly available tools and resources. It is provided without warranty, and could contain inaccuracies. Use at your own risk.