Categories in Trang, Thailand
Industries
Business Distribution by Industry in Trang, Thailand
| Industry Description | Number of Establishments | Average Google Rating |
|---|---|---|
| Shopping | 368 | 4 |
| Restaurants | 338 | 4.1 |
| Public administration | 199 | 4 |
| Education | 169 | 4.2 |
| Religion | 141 | 4.3 |
| Cafes | 98 | 4.1 |
| Health and medical | 95 | 4.1 |
| Other accommodation | 90 | 4 |
| Loan companies | 76 | 4.4 |
| Gas station | 73 | 3.9 |
| Thai restaurants | 67 | 4.2 |
| Automotive | 65 | 4.4 |
| Car repair | 63 | 4.2 |
| Banks | 60 | 4.2 |
| All food and beverage | 56 | 4 |
| Hotels and motels | 55 | 4 |
| Hospitals | 39 | 4.2 |
| Bakeries | 39 | 4.2 |
| Shopping other | 39 | 3.9 |
| Real estate | 39 | 4.5 |
| Atm's | 37 | 3.8 |
| Department stores | 36 | 4 |
| Electronics stores | 35 | 4.3 |
| Police and law enforcement | 35 | 4.5 |
| New car dealers | 34 | 3.9 |
Trang, Thailand Facts
| Area | 142.4 km² |
| Population | 161,196 |
| Male Population | 78,980 (49.0%) |
| Female Population | 82,216 (51.0%) |
| Population change (1975 to 2020) | +26.1% |
| Population change (2000 to 2020) | -6.3% |
| Median Age | 32.2 years (Male: 31.4, Female: 33.1) |
| Area Codes | 75 |
| Neighborhoods | Tambon Thap Thiang, Thap Thiang, Tambon Na Ta Luang, Tambon Na Yong Nuea, Tambon Wang Maprang Nuea |
| Local Time | |
| Timezone | Indochina Time |
| Lat & Lng | 7.55633, 99.61141 |
| Postal Codes | 92000, 92170 |
Map of Trang, Thailand
Interactive Map
Trang, Thailand Population
Years 1975 to 2020
| Data | 1975 | 1990 | 2000 | 2015 | 2020 |
|---|---|---|---|---|---|
| Population | 127,786 | 167,952 | 172,120 | 156,068 | 161,196 |
| Population Density | 897.5 / km² | 1,179.6 / km² | 1,208.9 / km² | 1,096.2 / km² | 1,132.2 / km² |
Trang, Thailand Population change from 2000 to 2015
Decrease of 9.3% from year 2000 to 2015
| Location | Change since 1975 | Change since 1990 | Change since 2000 |
|---|---|---|---|
| Trang, Thailand | +22.1% | -7.1% | -9.3% |
| Trang Province | +38.5% | +3.1% | -4.3% |
| Thailand | +60.4% | +20.1% | +8.3% |
Trang, Thailand Median Age
Median Age: 32.2 years
| Location | Median Age | Median Age (Female) | Median Age (Male) |
|---|---|---|---|
| Trang, Thailand | 32.2 yrs | 33.1 yrs | 31.4 yrs |
| Trang Province | 32.2 yrs | 33.1 yrs | 31.4 yrs |
| Thailand | 35.2 yrs | 36 yrs | 34.3 yrs |
Trang, Thailand Population Density
Population Density: 1,132 / km²
| Location | Population | Area | Density |
|---|---|---|---|
| Trang, Thailand | 161,196 | 142.4 km² | 1,132 / km² |
| Trang Province | 551,630 | 4,700.6 km² | 117 / km² |
| Thailand | 67.6 million | 514,961.7 km² | 131 / km² |
Trang, Thailand Historical and Projected Population
Estimated Population from 1800 to 2100
- JRC (European Commission's Joint Research Centre) work on the GHS built-up grid
- CIESIN (Center for International Earth Science Information Network)
- [Link] Klein Goldewijk, K., Beusen, A., Doelman, J., and Stehfest, E.: Anthropogenic land use estimates for the Holocene – HYDE 3.2, Earth Syst. Sci. Data, 9, 927–953, https://doi.org/10.5194/essd-9-927-2017, 2017.
Neighborhoods in Trang, Thailand
Percentage of businesses by neighborhood in Trang, Thailand
Area Codes
Percentage Area Codes used by businesses in Trang, Thailand
Postal Codes
Percentage of businesses by Postal Codes in Trang, Thailand
Price Distribution
Business distribution by price for Trang, Thailand
Human Development Index (HDI)
Statistic composite index of life expectancy, education, and per capita income.
Trang, Thailand CO2 Emissions
Carbon Dioxide (CO2) Emissions Per Capita in Tonnes Per Year
| Location | CO2 Emissions | CO2 Emissions Per Capita | CO2 Emissions Intensity |
|---|---|---|---|
| Trang, Thailand | 853,980 tn | 5.3 tn | 5,998.1 tons/km² |
| Trang Province | 2,758,050 tn | 5 tn | 586.7 tons/km² |
| Thailand | 278,589,420 tn | 4.12 tn | 541 tons/km² |
| 2013 CO2 emissions (tonnes/year) | 853,980 tn |
| 2013 CO2 emissions (tonnes/year) per capita | 5.3 tn |
| 2013 CO2 emissions intensity (tonnes/km²/year) | 5,998.1 tons/km² |
Natural Hazards Risk
Relative risk out of 10
| Hazard | Risk Level |
|---|---|
| Flood | High (10) |
| Earthquake | Low (2) |
| Landslide | Medium (6) |
* Risk, particularly concerning flood or landslide, may not be for the entire area.
- Dilley, M., R.S. Chen, U. Deichmann, A.L. Lerner-Lam, M. Arnold, J. Agwe, P. Buys, O. Kjekstad, B. Lyon, and G. Yetman. 2005. Natural Disaster Hotspots: A Global Risk Analysis. Washington, D.C.: World Bank. https://doi.org/10.1596/0-8213-5930-4.
- Center for Hazards and Risk Research - CHRR - Columbia University, Center for International Earth Science Information Network - CIESIN - Columbia University, and Norwegian Geotechnical Institute - NGI. 2005. Global Landslide Hazard Distribution. Palisades, NY: NASA Socioeconomic Data and Applications Center (SEDAC). https://doi.org/10.7927/H4P848VZ.
- Center for Hazards and Risk Research - CHRR - Columbia University, Center for International Earth Science Information Network - CIESIN - Columbia University. 2005. Global Flood Hazard Frequency and Distribution. Palisades, NY: NASA Socioeconomic Data and Applications Center (SEDAC). https://doi.org/10.7927/H4668B3D.
- Center for Hazards and Risk Research - CHRR - Columbia University, Center for International Earth Science Information Network - CIESIN - Columbia University. 2005. Global Earthquake Hazard Distribution - Peak Ground Acceleration. Palisades, NY: NASA Socioeconomic Data and Applications Center (SEDAC). https://doi.org/10.7927/H4BZ63ZS.
Recent Nearby Earthquakes
Magnitude 3.0 and greater
| Date▼ | Time↕ | Magnitude↕ | Distance↕ | Depth↕ | Location↕ | Link |
|---|---|---|---|---|---|---|
| 3/24/15 | 10:32 PM | 3.4 | 98.7 km | 10,000 m | 26km SE of Ban Phlu Nai (1), Thailand | usgs.gov |
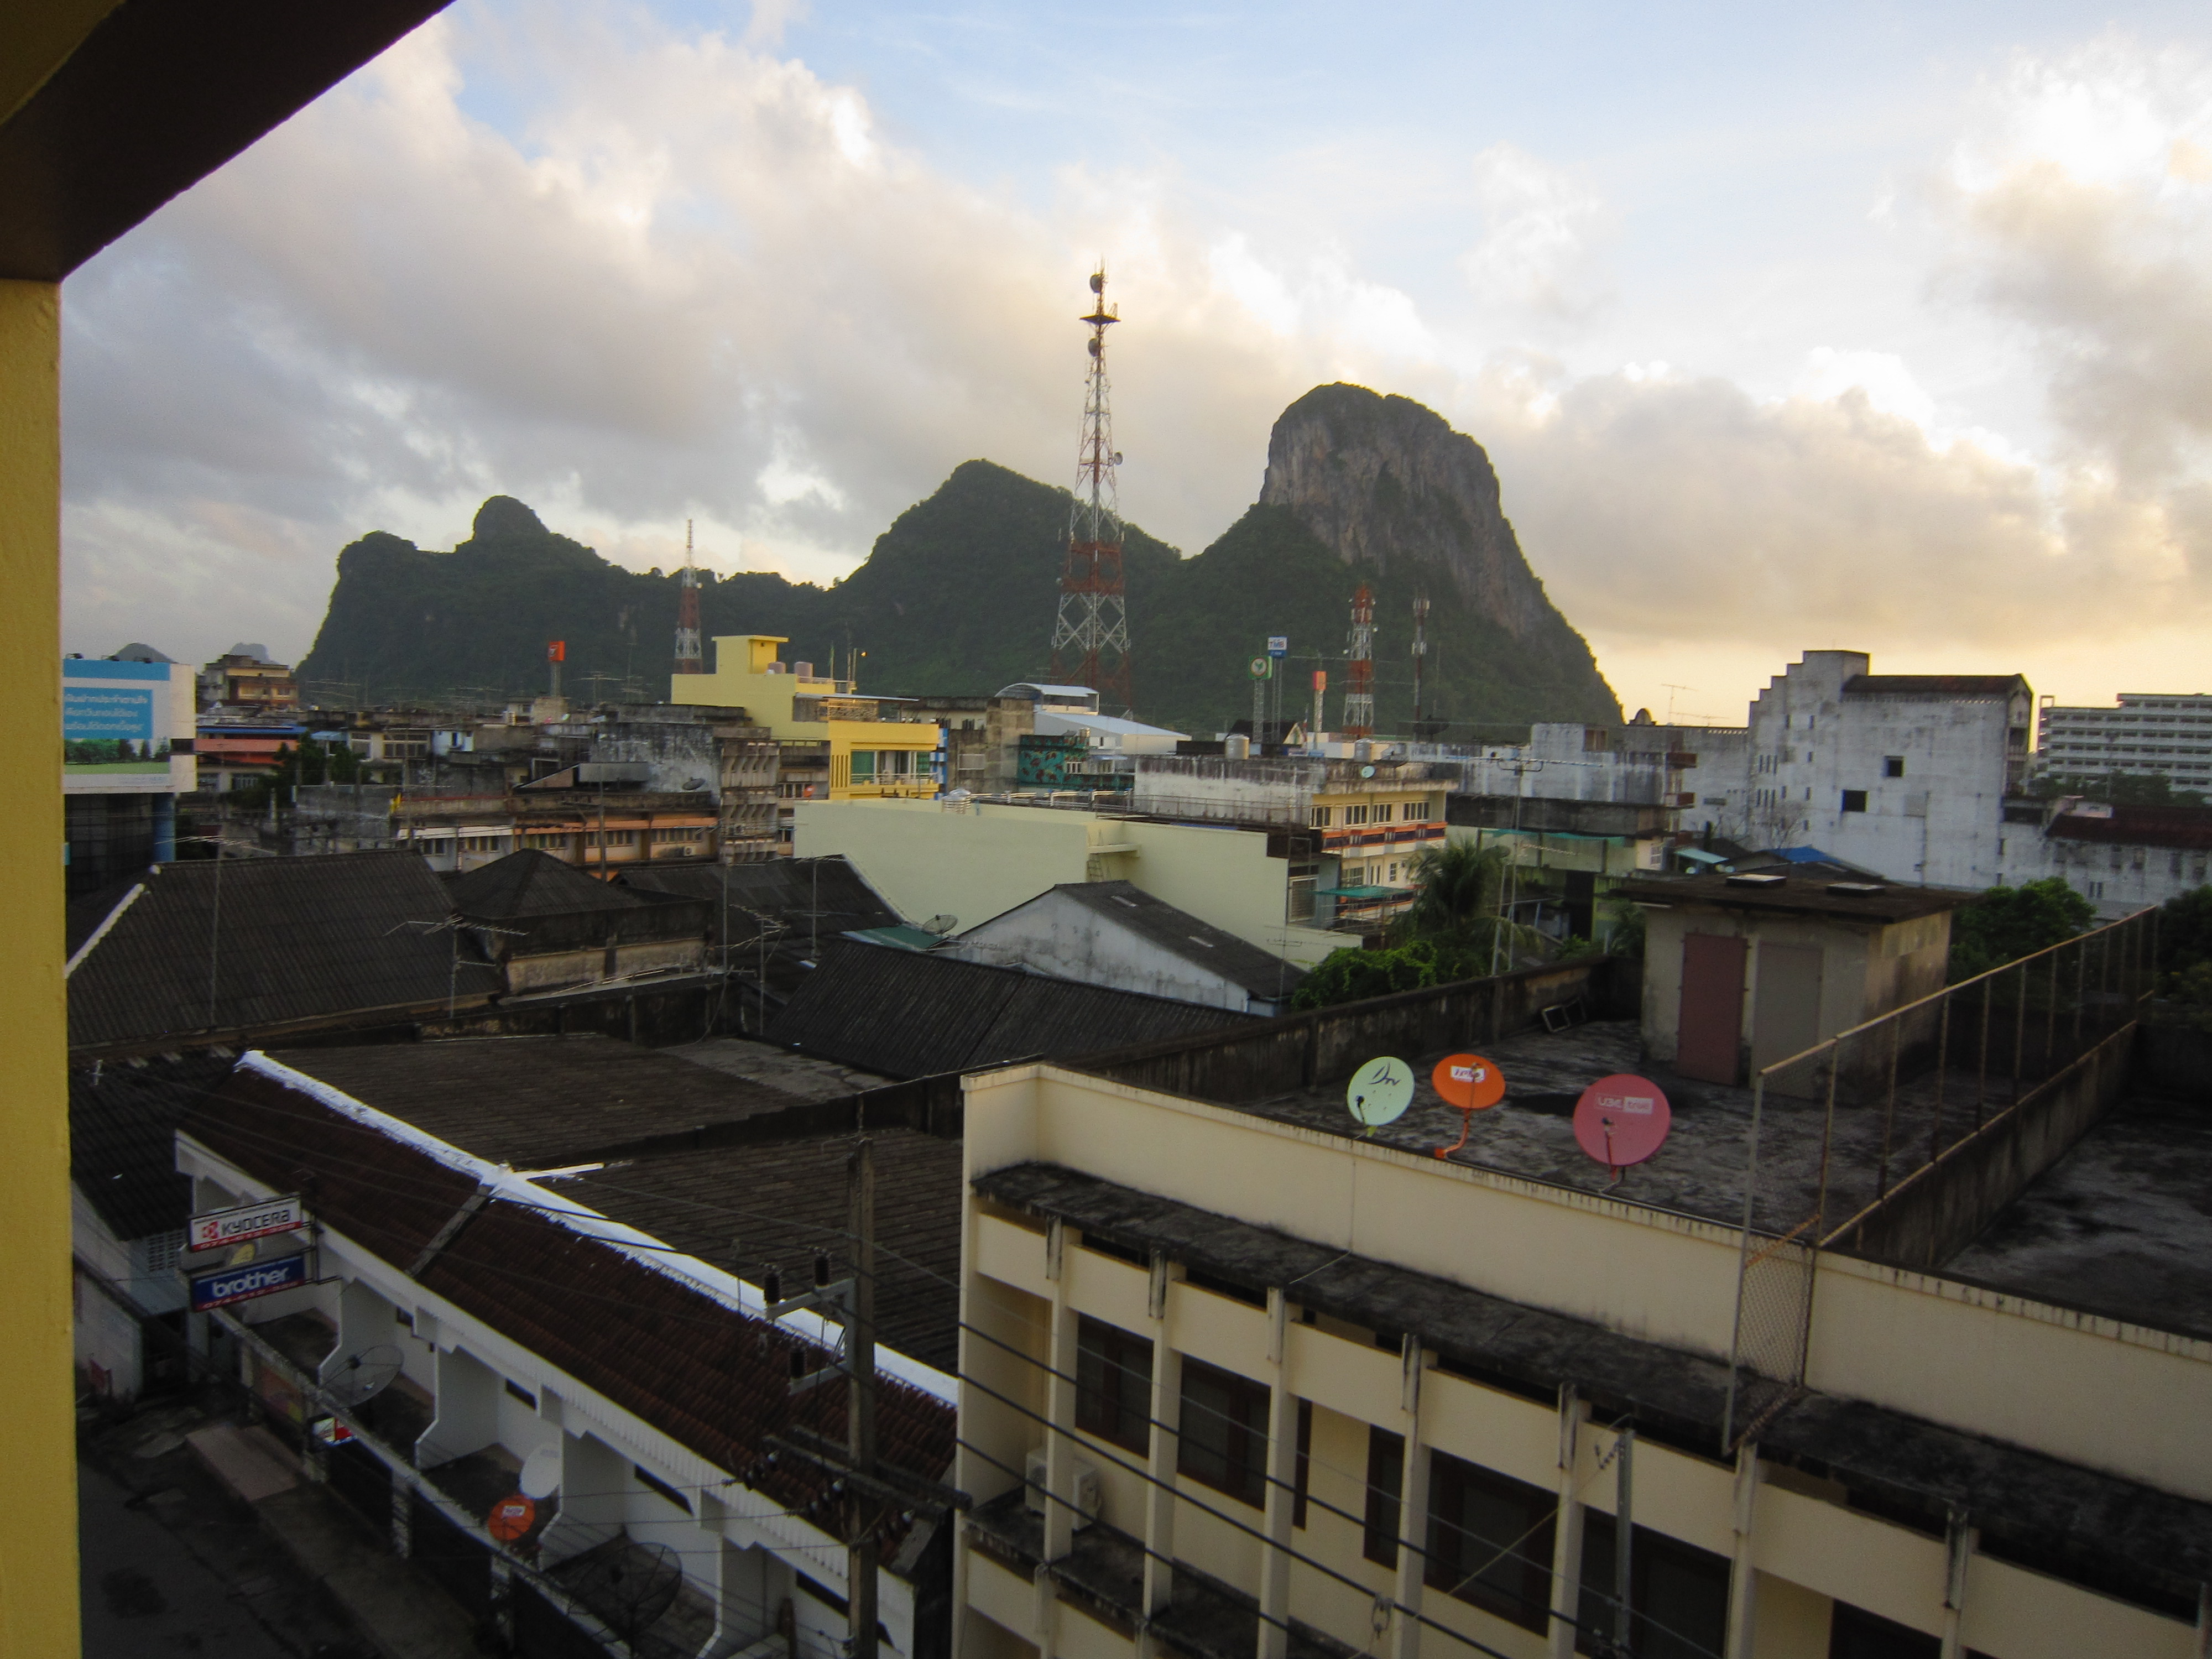
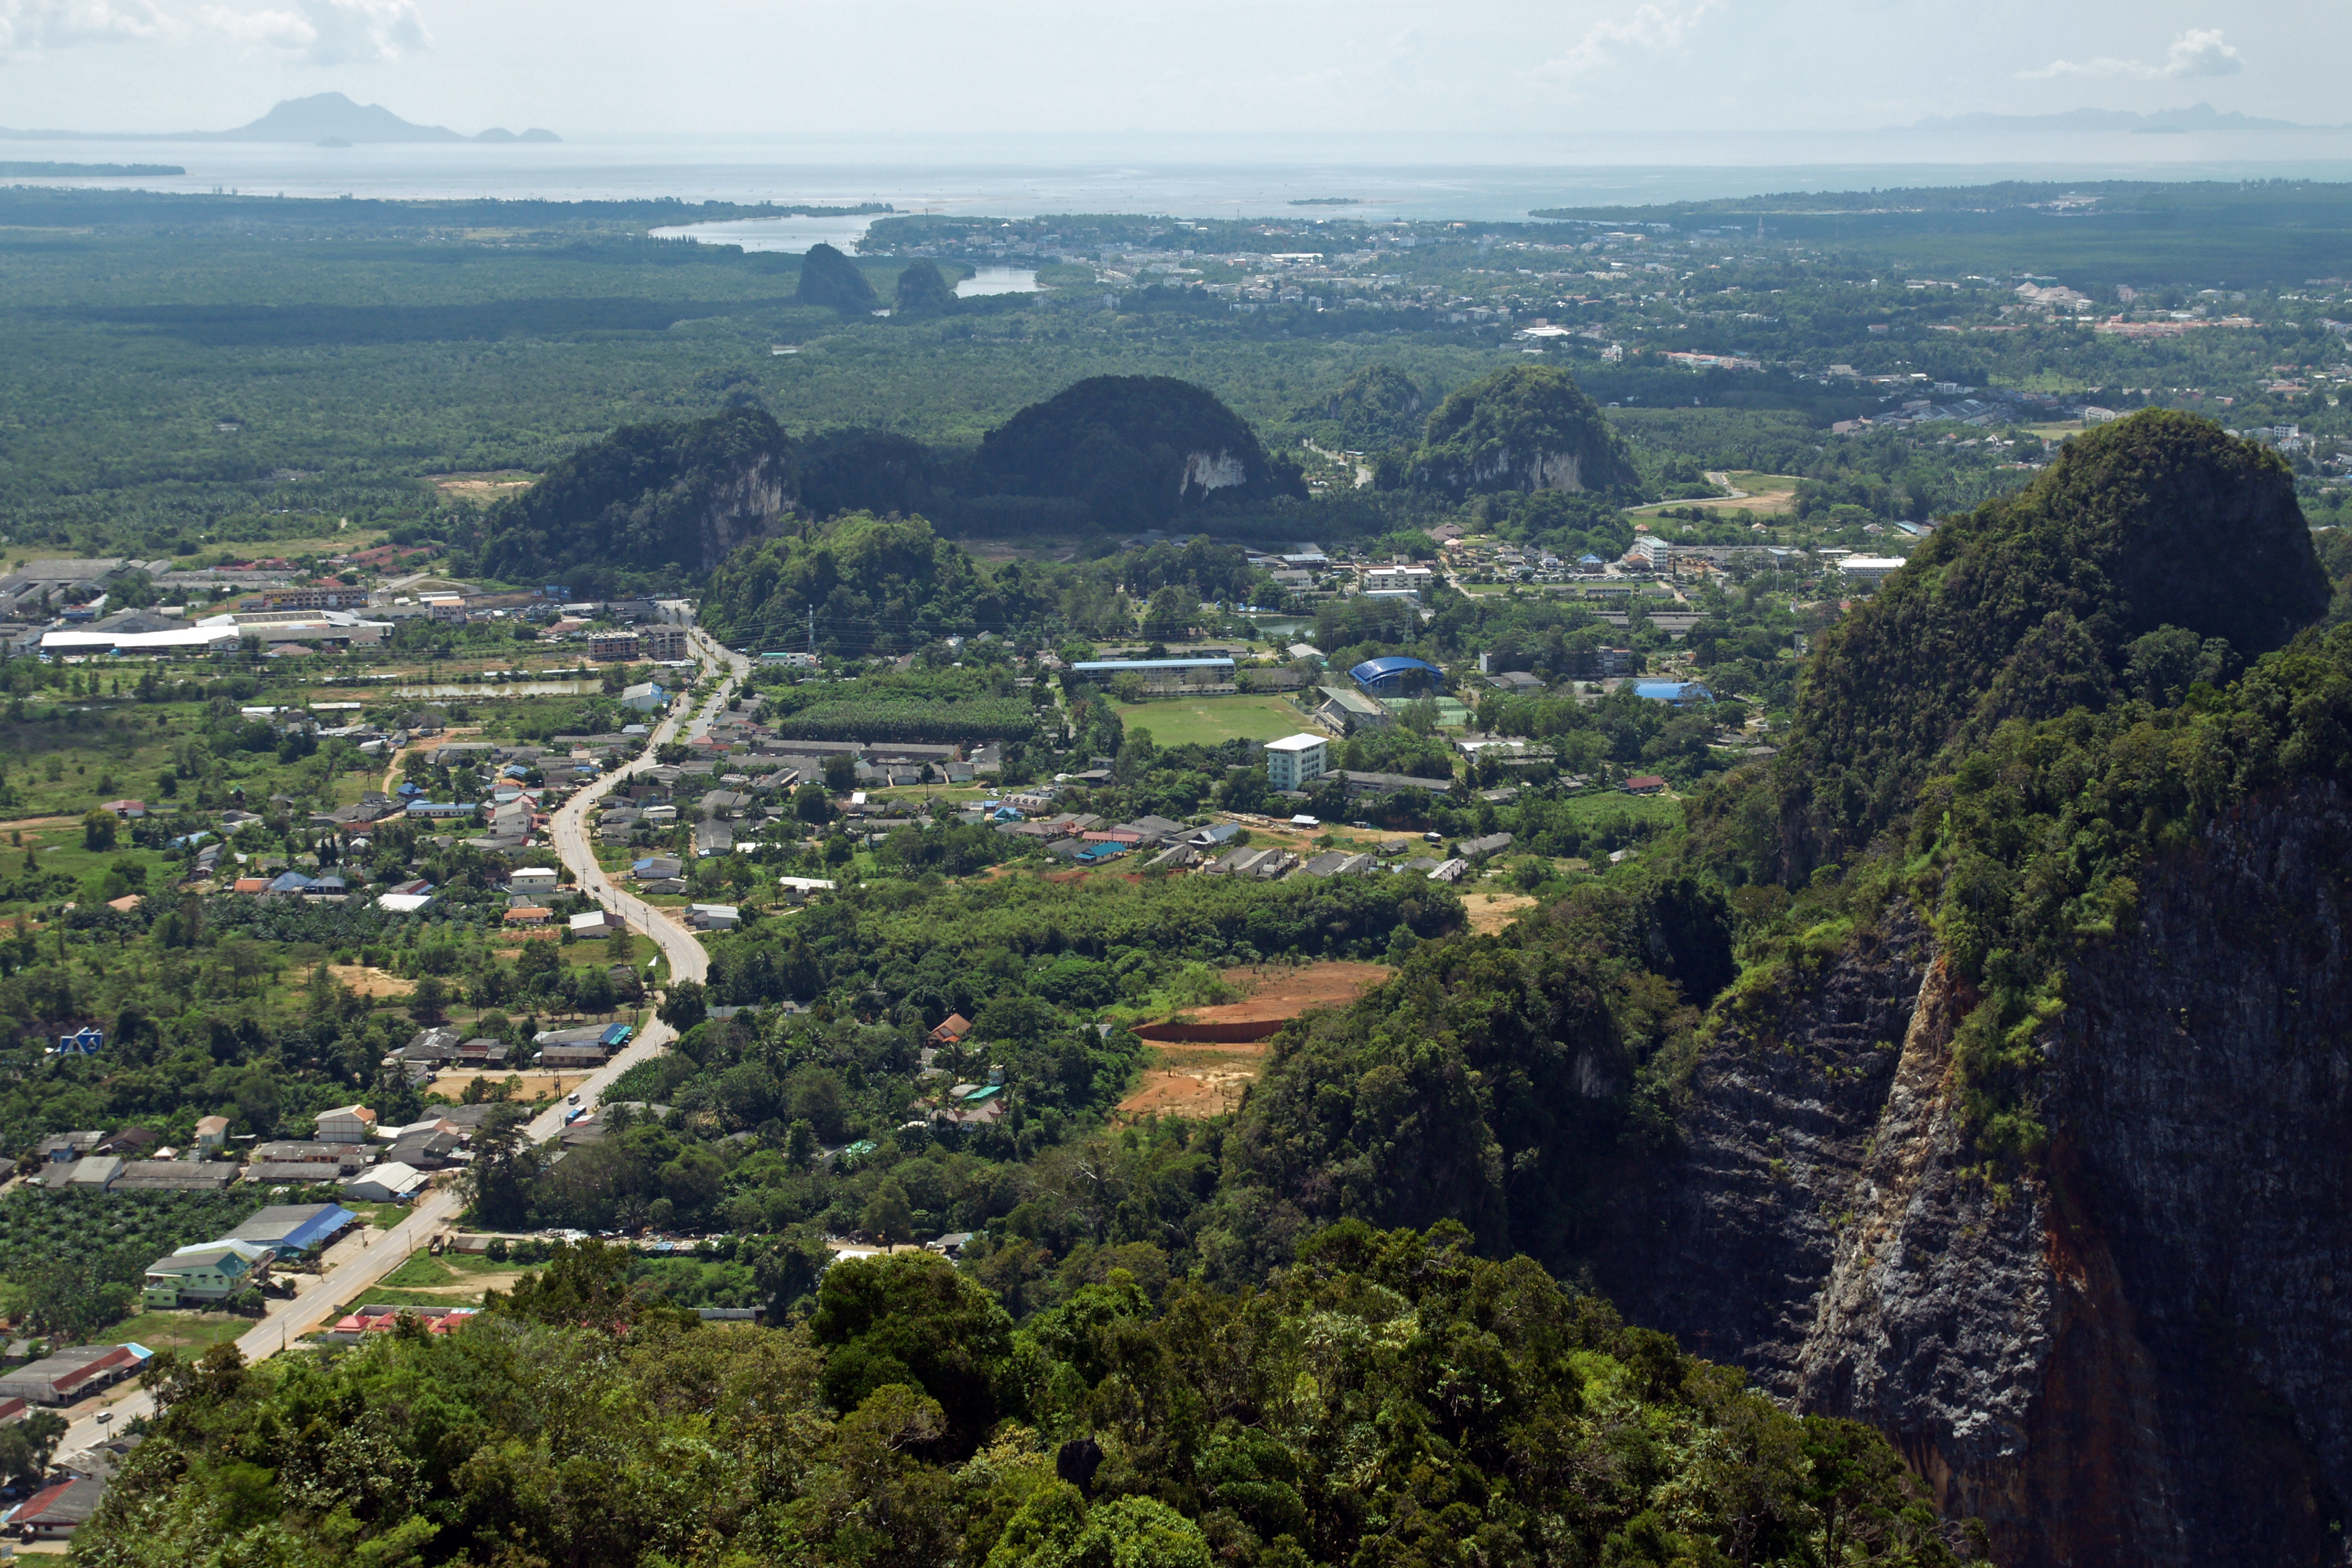
Trang, Thailand
Trang (Thai: ตรัง, IPA: [traŋ], also Mueang Thap Thiang เมืองทับเที่ยง) is the capital of Trang Province, Thailand. The city (thesaban nakhon) has a population of 59,637 (2005) and covers the whole tambon Thap Thiang of Mueang Trang district. Trang i..
Trang, Thailand Wikipedia Page

About Our Data
The data on this page is estimated using a number of publicly available tools and resources. It is provided without warranty, and could contain inaccuracies. Use at your own risk.