Categories in Cide
Industries
Business Distribution by Industry in Cide
| Industry Description | Number of Establishments |
|---|---|
| Restaurants | 102 |
| Grocery stores and supermarkets | 62 |
| Cafes | 40 |
| Other accommodation | 31 |
| Public administration | 30 |
| Religion | 25 |
| Car repair | 23 |
| Education | 19 |
| Furniture stores | 19 |
| Shopping | 17 |
Cide Facts
| Area | 730.5 km² |
| Population | 19,547 |
| Male Population | 9,780 (50.0%) |
| Female Population | 9,767 (50.0%) |
| Population change (1975 to 2020) | +77.8% |
| Population change (2000 to 2020) | -5.8% |
| Median Age | 42.1 years (Male: 41.1, Female: 43.2) |
| GDP per capita (PPP) | $12,159 (2022) |
| Neighborhoods | Kasaba Mahallesi, Nasuh Mahallesi, Memiş Mahallesi, Cumhuriyet Mahallesi, Kemerli Mahallesi |
| Local Time | |
| Timezone | Türkiye Standard Time |
| Lat & Lng | 41.89211, 33.00439 |
| Postal Codes | 37600, 37602 |
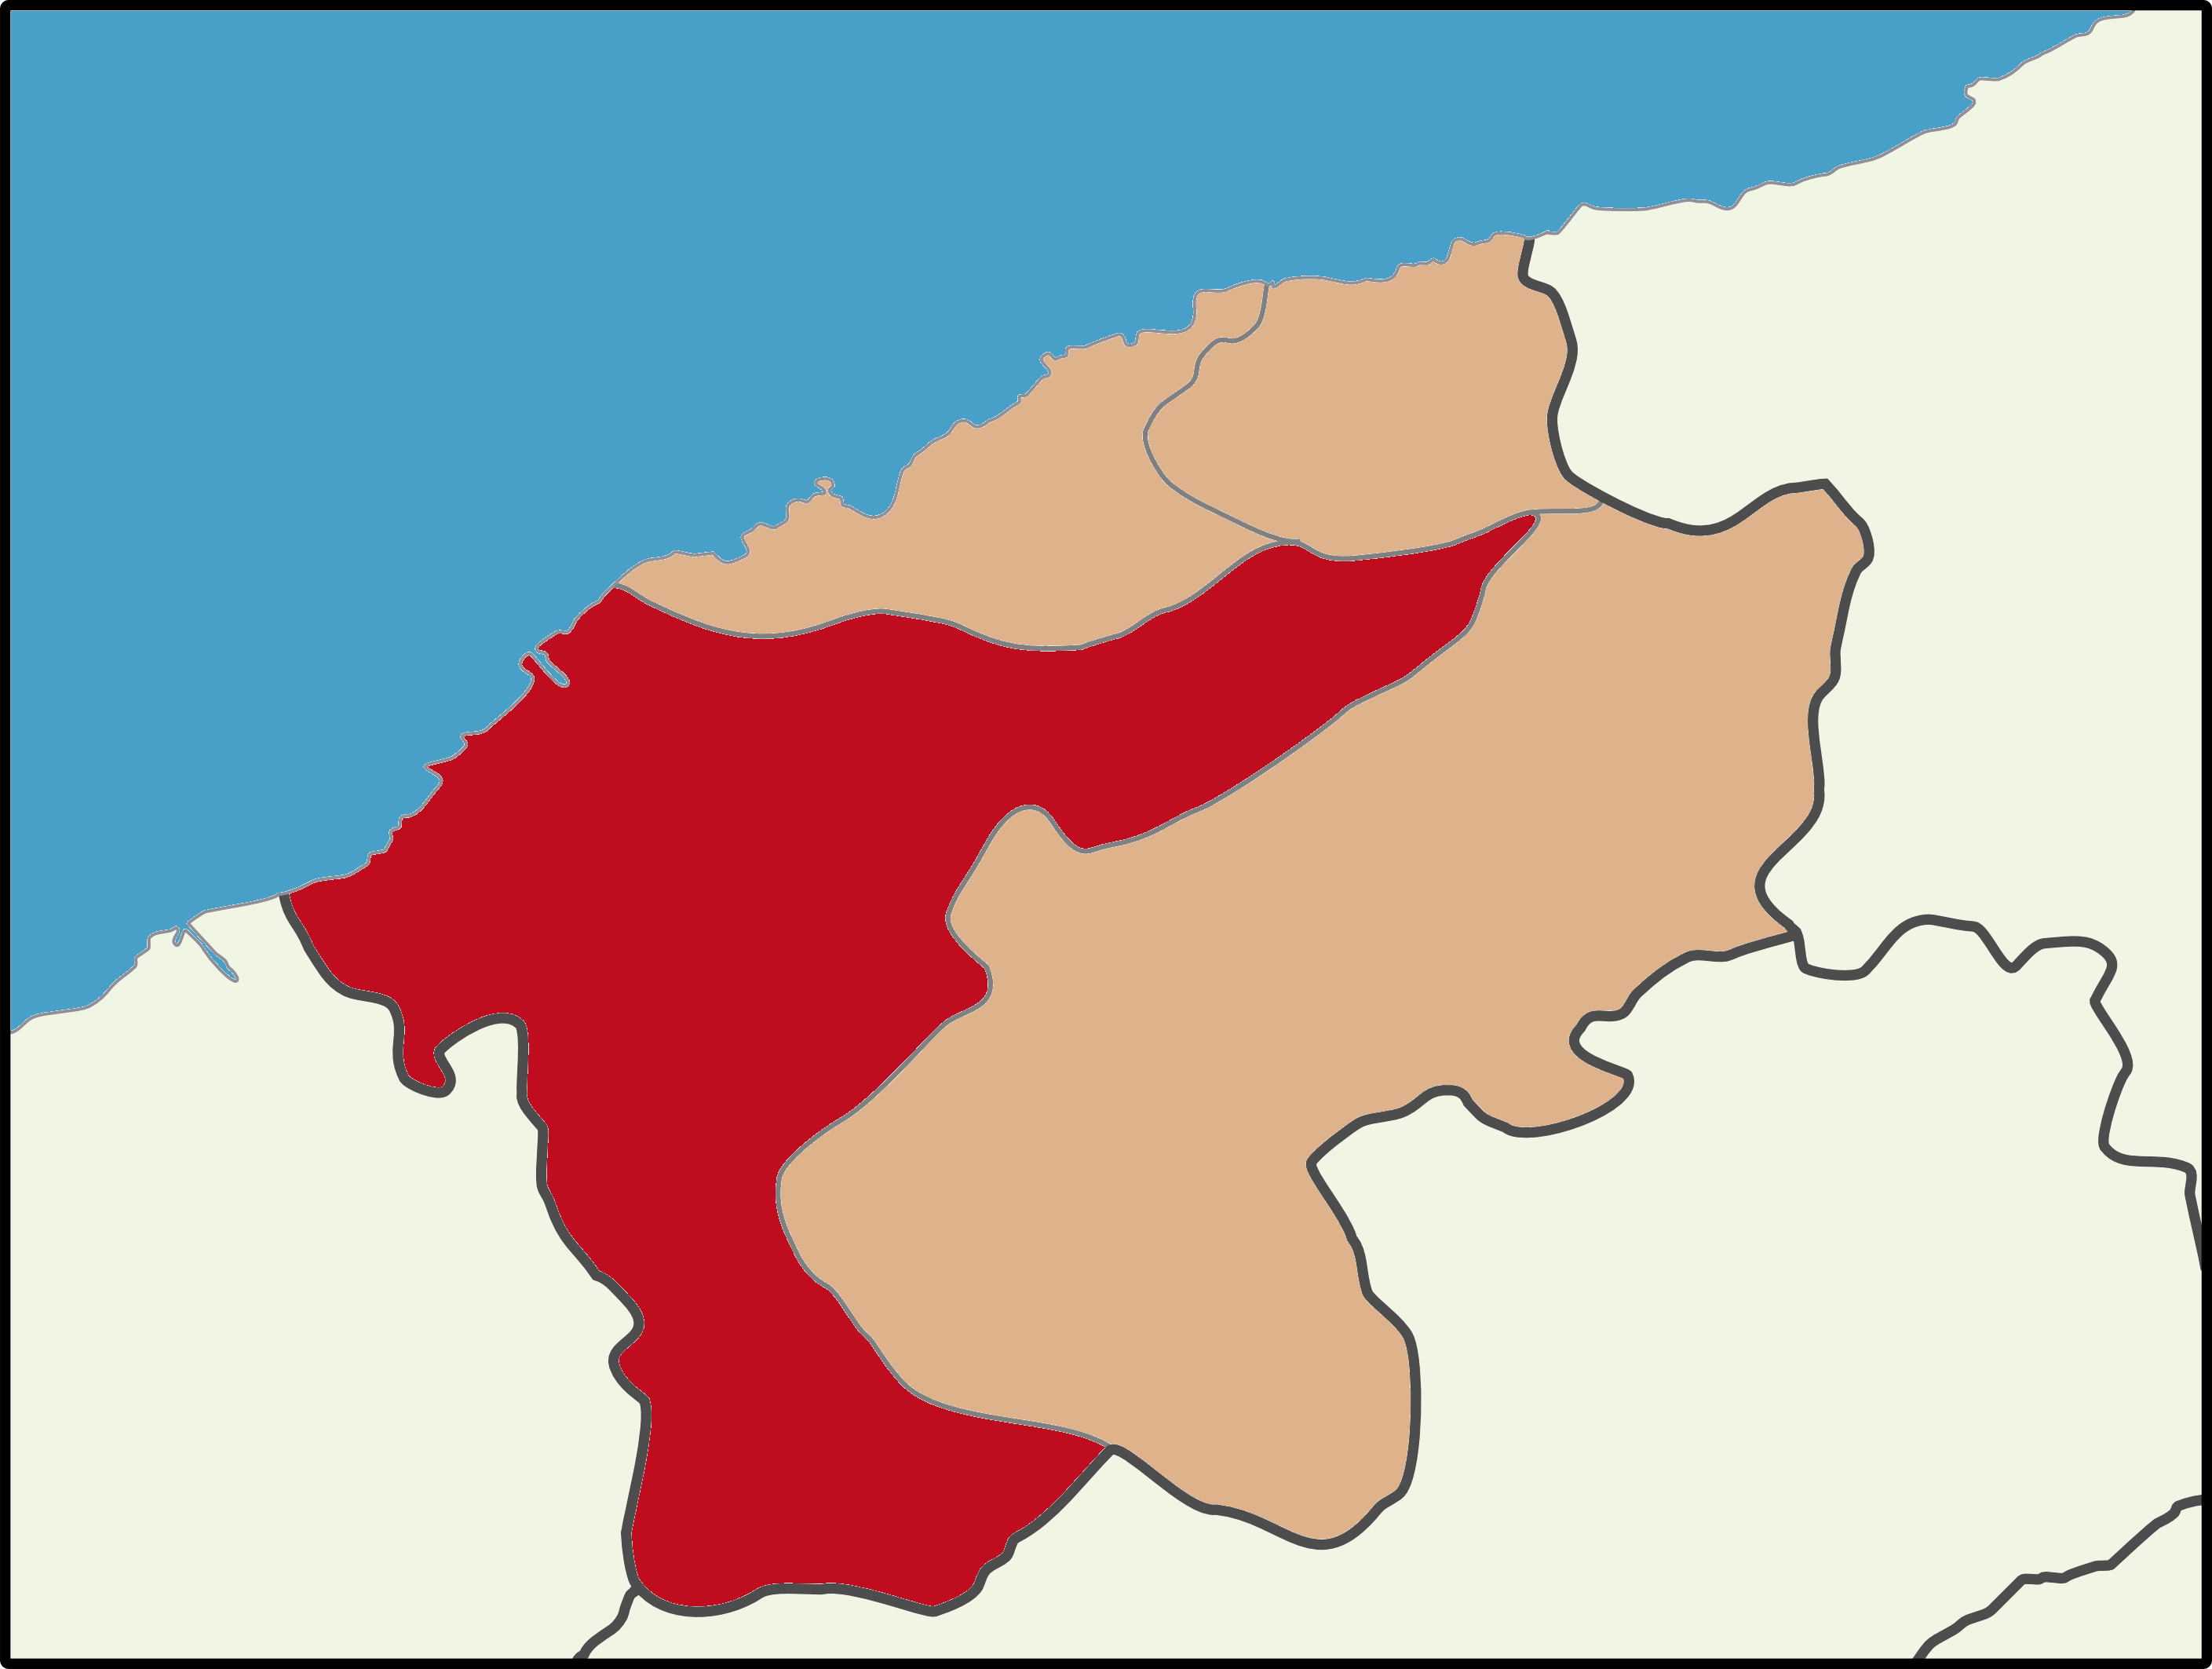
Map of Cide
Interactive Map
Cide Population
Years 1975 to 2030
| Data | 1975 | 1990 | 2000 | 2015 | 2020 | 2025* | 2030* |
|---|---|---|---|---|---|---|---|
| Population | 10,993 | 18,962 | 20,752 | 19,485 | 19,547 | 19,469 | 19,722 |
| Population Density | 15 / km² | 26 / km² | 28.4 / km² | 26.7 / km² | 26.8 / km² | 26.7 / km² | 27 / km² |
Cide Population change from 2000 to 2020
Decrease of 5.8% from year 2000 to 2020
| Location | Change since 1975 | Change since 1990 | Change since 2000 |
|---|---|---|---|
| Cide | +77.8% | +3.1% | -5.8% |
| Kastamonu Province | — | — | — |
| Turkey | — | — | — |
Cide Median Age
Median Age: 42.1 years
| Location | Median Age | Median Age (Female) | Median Age (Male) |
|---|---|---|---|
| Cide | 42.1 yrs | 43.2 yrs | 41.1 yrs |
| Kastamonu Province | 35.9 yrs | 37.4 yrs | 34.5 yrs |
| Turkey | 29.3 yrs | 29.8 yrs | 28.7 yrs |
Cide Population Density
Population Density: 26.8 / km²
| Location | Population | Area | Density |
|---|---|---|---|
| Cide | 19,547 | 730.5 km² | 26.8 / km² |
| Kastamonu Province | 363,138 | 13,057.3 km² | 27.8 / km² |
| Turkey | 77.8 million | 780,782.9 km² | 99.6 / km² |
Cide Historical and Projected Population
Estimated Population from 0 to 2100
- JRC (European Commission's Joint Research Centre) work on the GHS built-up grid
- CIESIN (Center for International Earth Science Information Network)
- [Link] Klein Goldewijk, K., Beusen, A., Doelman, J., and Stehfest, E.: Anthropogenic land use estimates for the Holocene – HYDE 3.2, Earth Syst. Sci. Data, 9, 927–953, https://doi.org/10.5194/essd-9-927-2017, 2017.
Neighborhoods in Cide
Percentage of businesses by neighborhood in Cide
Price Distribution
Business distribution by price for Cide
Human Development Index (HDI)
Statistic composite index of life expectancy, education, and per capita income.
Cide Gross Domestic Product (GDP)
GDP per capita, PPP (constant 2017 international $)
| Data | 1990 | 1995 | 2000 | 2005 | 2010 | 2015 | 2020 | 2022 |
|---|---|---|---|---|---|---|---|---|
| GDP per capita | $1,911 | $2,677 | $5,084 | $3,476 | $7,095 | $8,613 | $10,096 | $12,159 |
| Total GDP | $29.6M | $44.8M | $90.7M | $61.8M | $122.2M | $156.5M | $184.6M | $221.9M |
Cide CO2 Emissions
Carbon Dioxide (CO2) Emissions Per Capita in Tonnes Per Year
| Location | CO2 Emissions | CO2 Emissions Per Capita | CO2 Emissions Intensity |
|---|---|---|---|
| Cide | 104,226 tn | 5.33 tn | 142.7 tons/km² |
| Kastamonu Province | 1,933,105 tn | 5.32 tn | 148 tons/km² |
| Turkey | 435,645,812 tn | 5.6 tn | 558 tons/km² |
| 2013 CO2 emissions (tonnes/year) | 104,226 tn |
| 2013 CO2 emissions (tonnes/year) per capita | 5.33 tn |
| 2013 CO2 emissions intensity (tonnes/km²/year) | 142.7 tons/km² |
Natural Hazards Risk
Relative risk out of 10
| Hazard | Risk Level |
|---|---|
| Earthquake | Medium (5) |
| Landslide | Medium (7) |
* Risk, particularly concerning flood or landslide, may not be for the entire area.
- Dilley, M., R.S. Chen, U. Deichmann, A.L. Lerner-Lam, M. Arnold, J. Agwe, P. Buys, O. Kjekstad, B. Lyon, and G. Yetman. 2005. Natural Disaster Hotspots: A Global Risk Analysis. Washington, D.C.: World Bank. https://doi.org/10.1596/0-8213-5930-4.
- Center for Hazards and Risk Research - CHRR - Columbia University, Center for International Earth Science Information Network - CIESIN - Columbia University, and Norwegian Geotechnical Institute - NGI. 2005. Global Landslide Hazard Distribution. Palisades, NY: NASA Socioeconomic Data and Applications Center (SEDAC). https://doi.org/10.7927/H4P848VZ.
- Center for Hazards and Risk Research - CHRR - Columbia University, Center for International Earth Science Information Network - CIESIN - Columbia University. 2005. Global Earthquake Hazard Distribution - Peak Ground Acceleration. Palisades, NY: NASA Socioeconomic Data and Applications Center (SEDAC). https://doi.org/10.7927/H4BZ63ZS.
Recent Nearby Earthquakes
Magnitude 3.0 and greater
| Date▼ | Time↕ | Magnitude↕ | Distance↕ | Depth↕ | Location↕ | Link |
|---|---|---|---|---|---|---|
| 5/8/15 | 7:14 PM | 3.9 | 33.8 km | 15,600 m | 11km NNE of Azdavay, Turkey | usgs.gov |
| 9/4/14 | 3:53 AM | 4.5 | 49.4 km | 4,500 m | 12km WNW of Ulus, Turkey | usgs.gov |
| 7/24/13 | 12:59 PM | 4 | 50.4 km | 5,000 m | 8km SE of Amasra, Turkey | usgs.gov |
| 7/21/13 | 9:43 PM | 4.5 | 93.8 km | 4,100 m | 10km S of Ihsangazi, Turkey | usgs.gov |
| 11/22/09 | 2:01 AM | 4.5 | 76 km | 5,000 m | central Turkey | usgs.gov |
| 4/20/06 | 2:10 PM | 4.1 | 45.8 km | 15,000 m | central Turkey | usgs.gov |
| 12/26/05 | 8:29 PM | 3.2 | 41.7 km | 8,000 m | central Turkey | usgs.gov |
| 8/12/03 | 8:05 PM | 3.8 | 91.1 km | 10,000 m | central Turkey | usgs.gov |
| 6/1/01 | 12:39 AM | 3.3 | 82 km | 11,000 m | central Turkey | usgs.gov |
| 7/5/99 | 2:57 AM | 3.5 | 74.8 km | 10,000 m | central Turkey | usgs.gov |
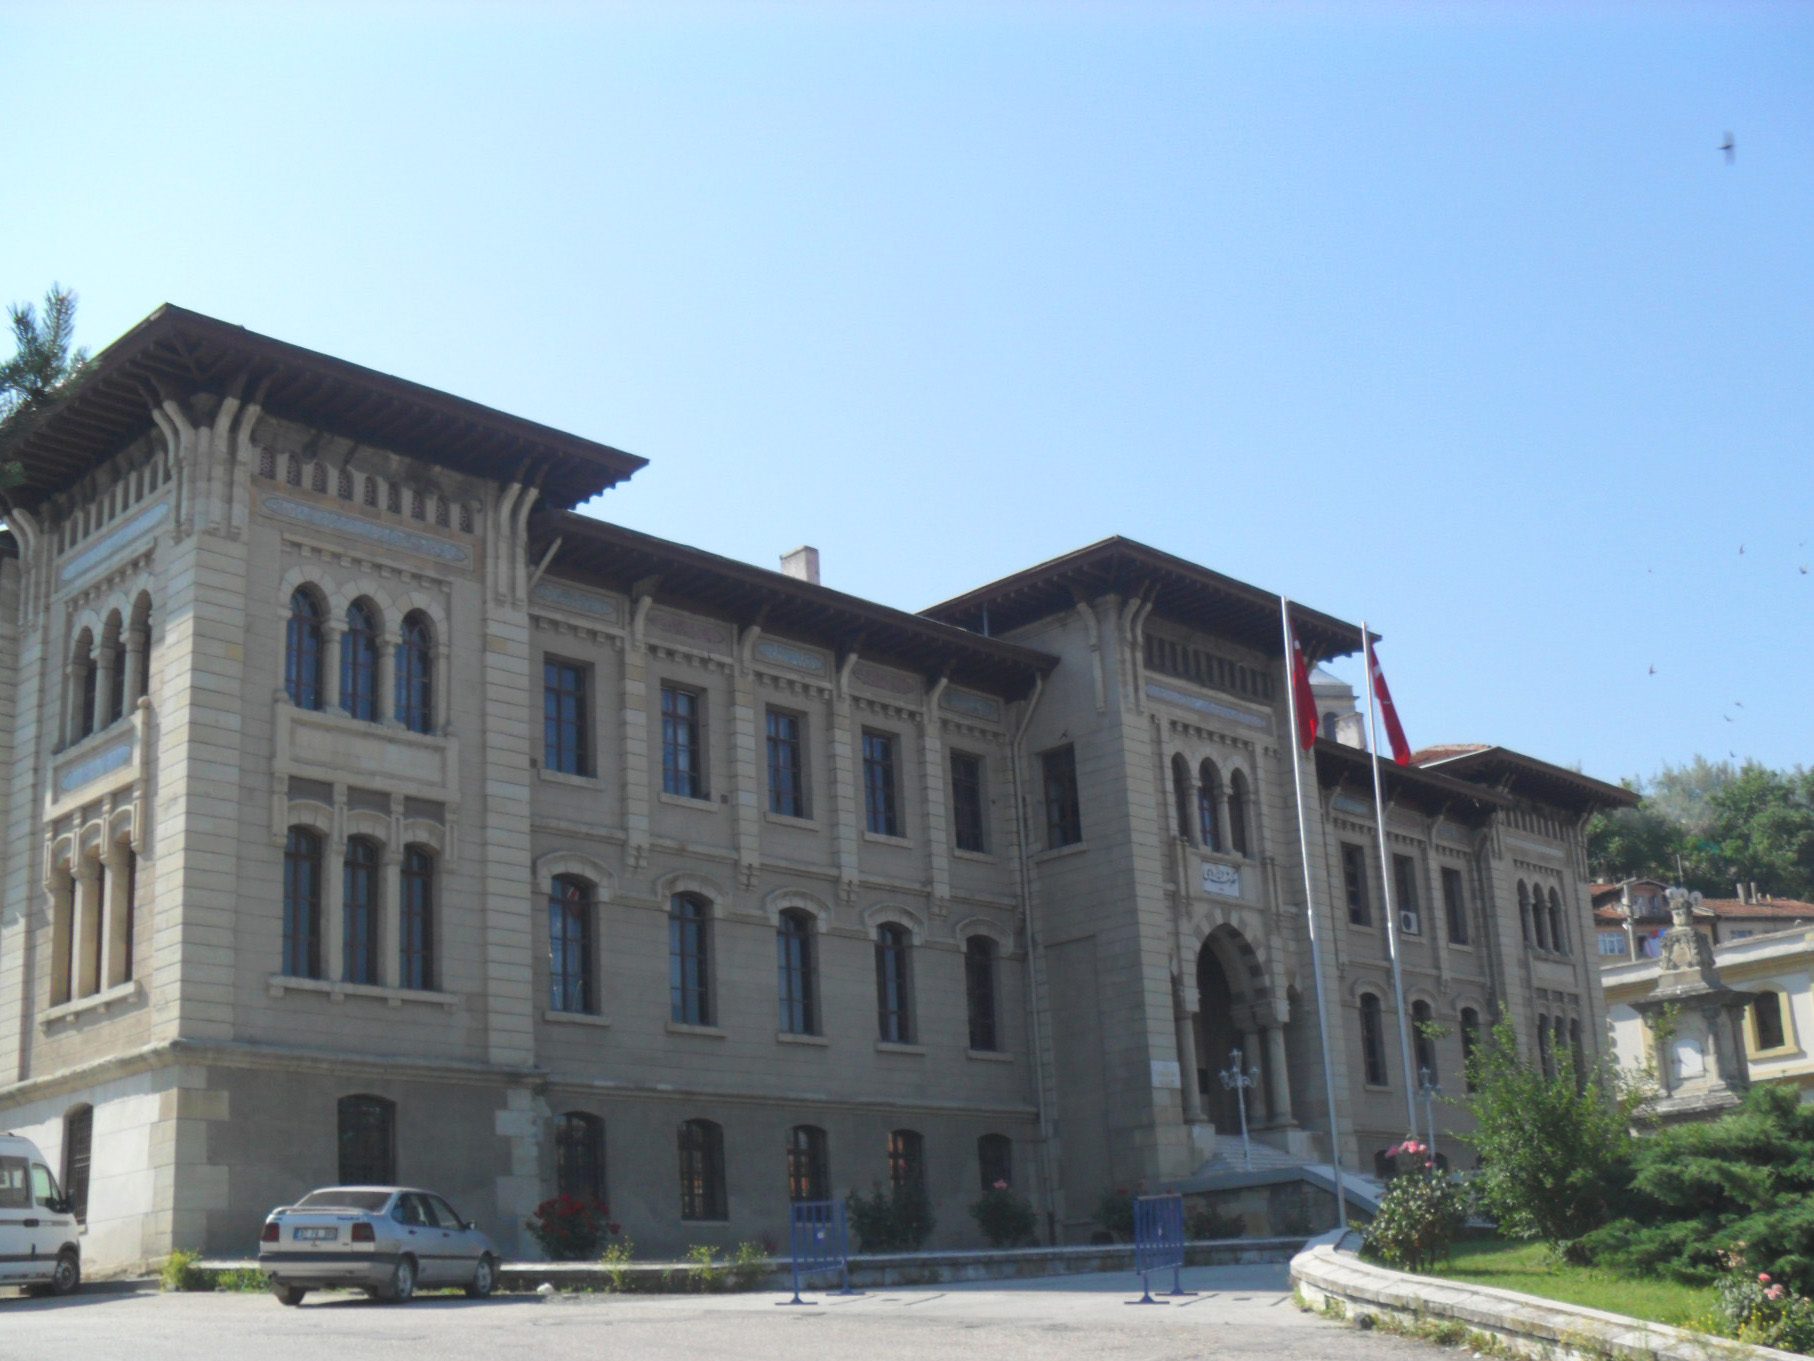
Cide
Cide, also Karaağaç, is a town and district of the Kastamonu Province in the Black Sea region of Turkey. According to the 2000 census, population of the district is 23,161 of which 5,834 live in the town of Cide. The district covers an area of 664 km..
Cide Wikipedia Page

About Our Data
The data on this page is estimated using a number of publicly available tools and resources. It is provided without warranty, and could contain inaccuracies. Use at your own risk.