Industries
Business Distribution by Industry in Olur
| Industry Description | Number of Establishments | Average Google Rating |
|---|---|---|
| Public administration | 15 | 5 |
| Shopping | 6 | 4.5 |
| Restaurants | 6 | 4.5 |
| Other accommodation | 5 | 2.9 |
| Hostels | 5 | 4 |
Olur Facts
| Area | 880.8 km² |
| Population | 8,862 |
| Male Population | 4,396 (49.6%) |
| Female Population | 4,466 (50.4%) |
| Population change (1975 to 2020) | -36.7% |
| Population change (2000 to 2020) | -25.2% |
| Median Age | 40.1 years (Male: 37.8, Female: 42.8) |
| Neighborhoods | Merkez Mahallesi, Aktepe Mahallesi, Bahçeşehir 1.Kısım |
| Local Time | |
| Timezone | Türkiye Standard Time |
| Lat & Lng | 40.82165, 42.13055 |
| Postal Codes | 25650 |
Map of Olur
Interactive Map
Olur Population
Years 1975 to 2020
| Data | 1975 | 1990 | 2000 | 2015 | 2020 |
|---|---|---|---|---|---|
| Population | 14,006 | 13,523 | 11,855 | 8,477 | 8,862 |
| Population Density | 15.9 / km² | 15.4 / km² | 13.5 / km² | 9.6 / km² | 10.1 / km² |
Olur Population change from 2000 to 2015
Decrease of 28.5% from year 2000 to 2015
| Location | Change since 1975 | Change since 1990 | Change since 2000 |
|---|---|---|---|
| Olur | -39.5% | -37.3% | -28.5% |
| Erzurum Province | -4.9% | -22.8% | -18.9% |
| Turkey | +102.3% | +46.5% | +24.7% |
Olur Median Age
Median Age: 40.1 years
| Location | Median Age | Median Age (Female) | Median Age (Male) |
|---|---|---|---|
| Olur | 40.1 yrs | 42.8 yrs | 37.8 yrs |
| Erzurum Province | 25.1 yrs | 25.5 yrs | 24.8 yrs |
| Turkey | 29.3 yrs | 29.8 yrs | 28.7 yrs |
Olur Population Density
Population Density: 10.1 / km²
| Location | Population | Area | Density |
|---|---|---|---|
| Olur | 8,862 | 880.8 km² | 10.1 / km² |
| Erzurum Province | 710,542 | 24,948.6 km² | 28.5 / km² |
| Turkey | 77.8 million | 780,782.9 km² | 99.6 / km² |
Olur Historical and Projected Population
Estimated Population from 0 to 2100
- JRC (European Commission's Joint Research Centre) work on the GHS built-up grid
- CIESIN (Center for International Earth Science Information Network)
- [Link] Klein Goldewijk, K., Beusen, A., Doelman, J., and Stehfest, E.: Anthropogenic land use estimates for the Holocene – HYDE 3.2, Earth Syst. Sci. Data, 9, 927–953, https://doi.org/10.5194/essd-9-927-2017, 2017.
Neighborhoods in Olur
Percentage of businesses by neighborhood in Olur
Price Distribution
Business distribution by price for Olur
Human Development Index (HDI)
Statistic composite index of life expectancy, education, and per capita income.
Olur CO2 Emissions
Carbon Dioxide (CO2) Emissions Per Capita in Tonnes Per Year
| Location | CO2 Emissions | CO2 Emissions Per Capita | CO2 Emissions Intensity |
|---|---|---|---|
| Olur | 46,485 tn | 5.25 tn | 52.8 tons/km² |
| Erzurum Province | 3,705,883 tn | 5.22 tn | 148.5 tons/km² |
| Turkey | 435,645,812 tn | 5.6 tn | 558 tons/km² |
| 2013 CO2 emissions (tonnes/year) | 46,485 tn |
| 2013 CO2 emissions (tonnes/year) per capita | 5.25 tn |
| 2013 CO2 emissions intensity (tonnes/km²/year) | 52.8 tons/km² |
Natural Hazards Risk
Relative risk out of 10
| Hazard | Risk Level |
|---|---|
| Flood | Medium (7) |
| Earthquake | High (8) |
| Landslide | High (9) |
* Risk, particularly concerning flood or landslide, may not be for the entire area.
- Dilley, M., R.S. Chen, U. Deichmann, A.L. Lerner-Lam, M. Arnold, J. Agwe, P. Buys, O. Kjekstad, B. Lyon, and G. Yetman. 2005. Natural Disaster Hotspots: A Global Risk Analysis. Washington, D.C.: World Bank. https://doi.org/10.1596/0-8213-5930-4.
- Center for Hazards and Risk Research - CHRR - Columbia University, Center for International Earth Science Information Network - CIESIN - Columbia University, and Norwegian Geotechnical Institute - NGI. 2005. Global Landslide Hazard Distribution. Palisades, NY: NASA Socioeconomic Data and Applications Center (SEDAC). https://doi.org/10.7927/H4P848VZ.
- Center for Hazards and Risk Research - CHRR - Columbia University, Center for International Earth Science Information Network - CIESIN - Columbia University. 2005. Global Flood Hazard Frequency and Distribution. Palisades, NY: NASA Socioeconomic Data and Applications Center (SEDAC). https://doi.org/10.7927/H4668B3D.
- Center for Hazards and Risk Research - CHRR - Columbia University, Center for International Earth Science Information Network - CIESIN - Columbia University. 2005. Global Earthquake Hazard Distribution - Peak Ground Acceleration. Palisades, NY: NASA Socioeconomic Data and Applications Center (SEDAC). https://doi.org/10.7927/H4BZ63ZS.
Recent Nearby Earthquakes
Magnitude 3.0 and greater
| Date▼ | Time↕ | Magnitude↕ | Distance↕ | Depth↕ | Location↕ | Link |
|---|---|---|---|---|---|---|
| 7/15/19 | 12:15 AM | 4.4 | 55.6 km | 10,000 m | 10km NW of Narman, Turkey | usgs.gov |
| 3/24/17 | 8:54 AM | 4.2 | 90.6 km | 4,470 m | 4km SSE of Horasan, Turkey | usgs.gov |
| 7/19/14 | 9:16 AM | 4.1 | 99.3 km | 10,000 m | 7km NNW of Akhaldaba, Georgia | usgs.gov |
| 5/28/14 | 12:03 AM | 4.3 | 17.2 km | 10,000 m | 17km NNW of Senkaya, Turkey | usgs.gov |
| 7/17/13 | 1:40 AM | 4.3 | 37.3 km | 5,000 m | 8km N of Oltu, Turkey | usgs.gov |
| 2/1/09 | 10:27 AM | 4.3 | 40.5 km | 3,500 m | eastern Turkey | usgs.gov |
| 5/13/08 | 3:11 AM | 3.3 | 56.4 km | 6,100 m | eastern Turkey | usgs.gov |
| 2/17/07 | 8:45 AM | 4.6 | 39.6 km | 5,000 m | eastern Turkey | usgs.gov |
| 1/12/07 | 11:04 PM | 3.6 | 93.6 km | 10,000 m | eastern Turkey | usgs.gov |
| 6/7/05 | 8:58 PM | 3.6 | 78.4 km | 30,100 m | eastern Turkey | usgs.gov |
Olur
Olur (Armenian: Տայոց քար, T'ayots k'ar, meaning "a rock from Tayk", Georgian: ტაოსკარი T'aosk'ari, (Kurdish: Tawûsker), meaning "the door of Tao", formerly Tavusker) was a historic district Taoskari of Georgia, nowadays the town and district of Erz..
Olur Wikipedia Page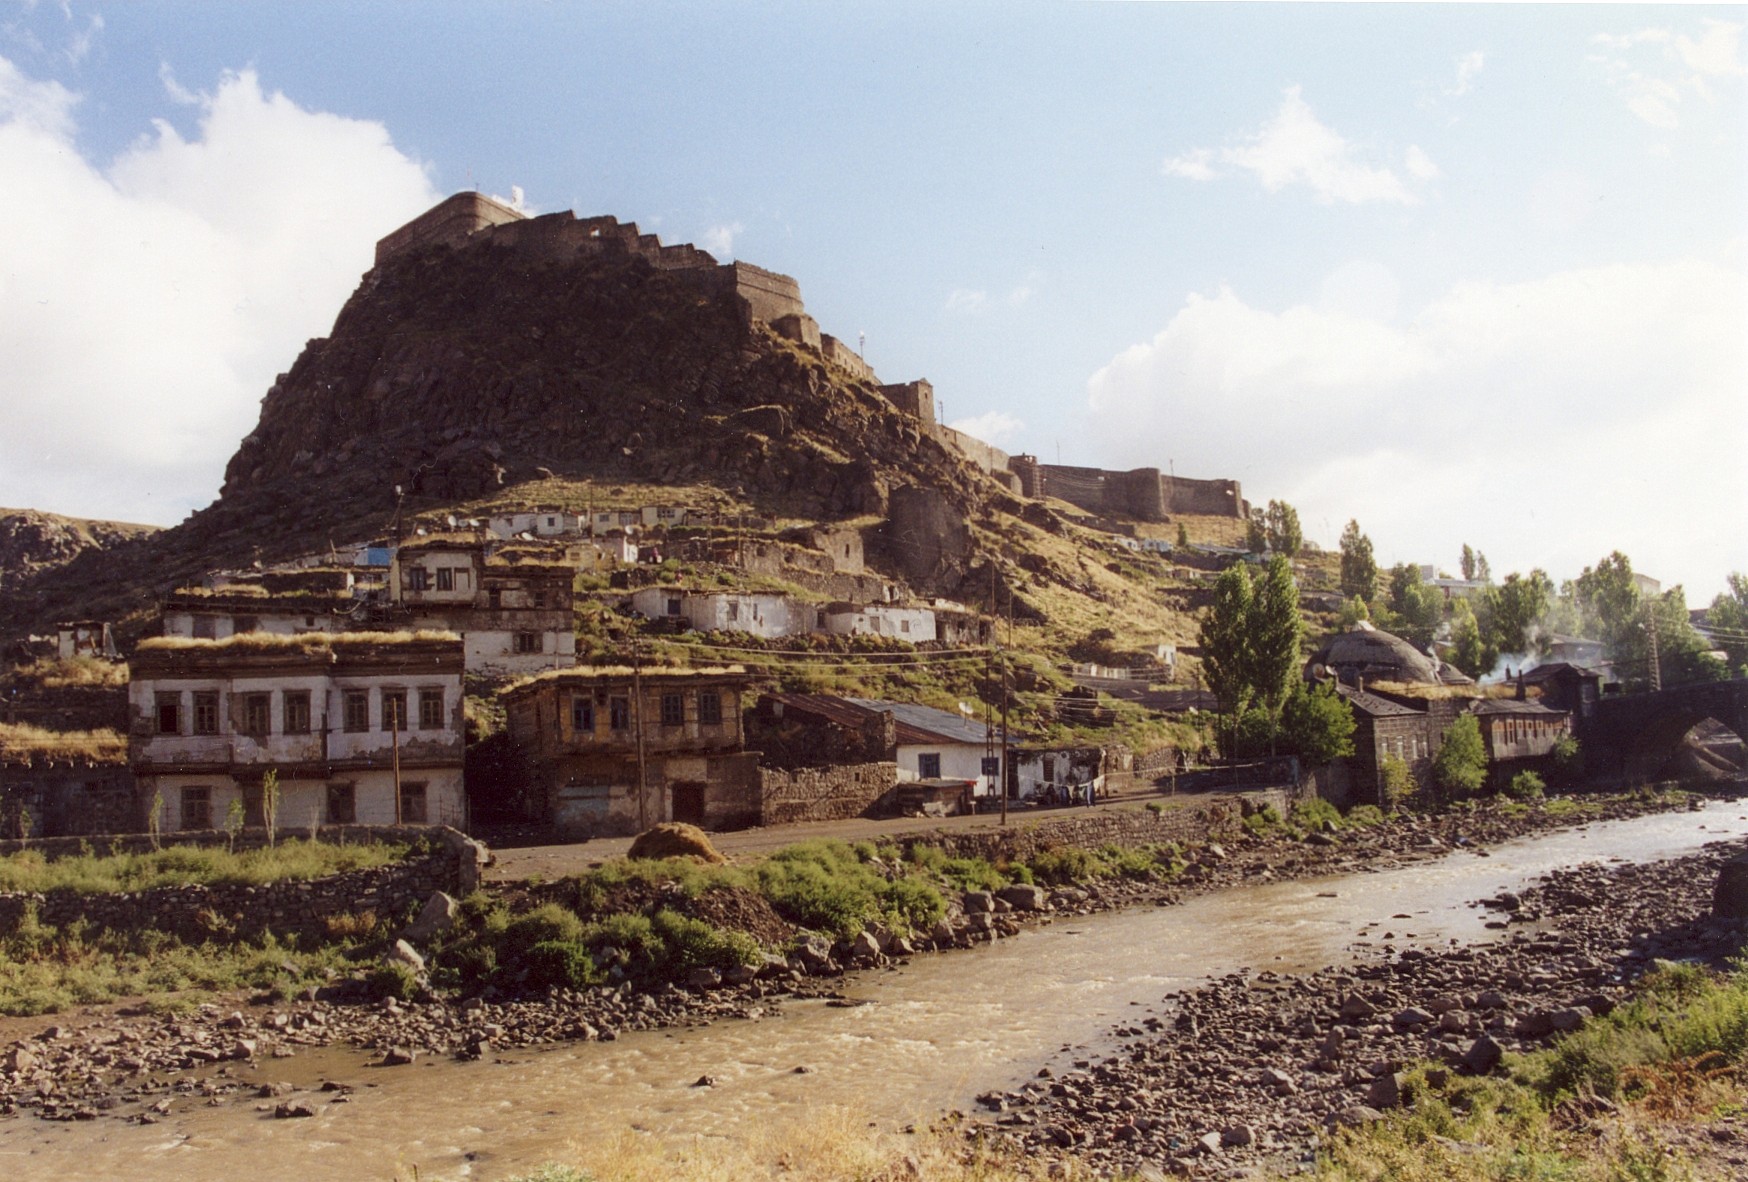


About Our Data
The data on this page is estimated using a number of publicly available tools and resources. It is provided without warranty, and could contain inaccuracies. Use at your own risk.