Categories in Belmont, California
Industries
Business Distribution by Industry in Belmont, California
| Industry Description | Number of Establishments | Average Age of Business |
|---|---|---|
| Health and medical | 210 | 38 years |
| Corporate management | 187 | 24 years |
| Real estate | 166 | 31 years |
| Restaurants | 141 | 30 years |
| Shopping | 119 | 29 years |
| Electronics stores | 115 | 28 years |
| Construction of buildings | 99 | 30 years |
| Car repair | 94 | 46 years |
| Dentists | 70 | 29 years |
| Education | 67 | 33 years |
| Other construction | 67 | 28 years |
| Hairdressers | 62 | 22 years |
Belmont, California Facts
| Area | 4.6 mi² |
| Population | 27,064 |
| Male Population | 13,124 (48.5%) |
| Female Population | 13,940 (51.5%) |
| Population change (1975 to 2020) | +86.4% |
| Population change (2000 to 2020) | +5.5% |
| Median Age | 41.2 years (Male: 40.2, Female: 42.1) |
| Area Codes | 415, 650 |
| Neighborhoods | Downtown Belmont, Central, Sterling Downs, McDougal, Homeview |
| Local Time | |
| Timezone | Pacific Daylight Time |
| Lat & Lng | 37.52021, -122.27580 |
| Zip Codes | 94002 |
Map of Belmont, California
Interactive Map
Belmont, California Population
Years 1975 to 2020
| Data | 1975 | 1990 | 2000 | 2015 | 2020 |
|---|---|---|---|---|---|
| Population | 14,522 | 21,656 | 25,664 | 25,886 | 27,064 |
| Population Density | 3,134.3 / mi² | 4,674.1 / mi² | 5,539.1 / mi² | 5,587 / mi² | 5,841.3 / mi² |
Belmont, California Population change from 2000 to 2015
Increase of 0.9% from year 2000 to 2015
| Location | Change since 1975 | Change since 1990 | Change since 2000 |
|---|---|---|---|
| Belmont, California | +78.3% | +19.5% | +0.9% |
| California | +51.8% | +28.5% | +13.9% |
| United States | +46.9% | +27.2% | +13.7% |
Belmont, California Median Age
Median Age: 41.2 years
| Location | Median Age | Median Age (Female) | Median Age (Male) |
|---|---|---|---|
| Belmont, California | 41.2 yrs | 42.1 yrs | 40.2 yrs |
| California | 35.3 yrs | 36.5 yrs | 34.2 yrs |
| United States | 37.4 yrs | 38.7 yrs | 36.1 yrs |
Belmont, California Population Density
Population Density: 5,841 / mi²
| Location | Population | Area | Density |
|---|---|---|---|
| Belmont, California | 27,064 | 4.633 sq mi | 5,841 / mi² |
| California | 38.8 million | 163,694.5 sq mi | 237 / mi² |
| United States | 321.6 million | 3,796,740.8 sq mi | 84.7 / mi² |
Belmont, California Historical and Projected Population
Estimated Population from 1890 to 2100
- JRC (European Commission's Joint Research Centre) work on the GHS built-up grid
- CIESIN (Center for International Earth Science Information Network)
- [Link] Klein Goldewijk, K., Beusen, A., Doelman, J., and Stehfest, E.: Anthropogenic land use estimates for the Holocene – HYDE 3.2, Earth Syst. Sci. Data, 9, 927–953, https://doi.org/10.5194/essd-9-927-2017, 2017.
Neighborhoods in Belmont, California
Percentage of businesses by neighborhood in Belmont, California
Price Distribution
Business distribution by price for Belmont, California
Human Development Index (HDI)
Statistic composite index of life expectancy, education, and per capita income.
Belmont, California CO2 Emissions
Carbon Dioxide (CO2) Emissions Per Capita in Tonnes Per Year
| Location | CO2 Emissions | CO2 Emissions Per Capita | CO2 Emissions Intensity |
|---|---|---|---|
| Belmont, California | 496,538 tn | 18.35 tn | 107,169.1 tons/mi² |
| California | 625,399,868 tn | 16.13 tn | 3,820.5 tons/mi² |
| United States | 5,664,619,810 tn | 17.62 tn | 1,492 tons/mi² |
| 2013 CO2 emissions (tonnes/year) | 496,538 tn |
| 2013 CO2 emissions (tonnes/year) per capita | 18.35 tn |
| 2013 CO2 emissions intensity (tonnes/mi²/year) | 107,169.1 tons/mi² |
Natural Hazards Risk
Relative risk out of 10
| Hazard | Risk Level |
|---|---|
| Drought | High (9.5) |
| Flood | Medium (4) |
| Earthquake | High (10) |
* Risk, particularly concerning flood or landslide, may not be for the entire area.
- Dilley, M., R.S. Chen, U. Deichmann, A.L. Lerner-Lam, M. Arnold, J. Agwe, P. Buys, O. Kjekstad, B. Lyon, and G. Yetman. 2005. Natural Disaster Hotspots: A Global Risk Analysis. Washington, D.C.: World Bank. https://doi.org/10.1596/0-8213-5930-4.
- Center for Hazards and Risk Research - CHRR - Columbia University, Center for International Earth Science Information Network - CIESIN - Columbia University, and International Research Institute for Climate and Society - IRI - Columbia University. 2005. Global Drought Hazard Frequency and Distribution. Palisades, NY: NASA Socioeconomic Data and Applications Center (SEDAC). https://doi.org/10.7927/H4VX0DFT.
- Center for Hazards and Risk Research - CHRR - Columbia University, Center for International Earth Science Information Network - CIESIN - Columbia University. 2005. Global Flood Hazard Frequency and Distribution. Palisades, NY: NASA Socioeconomic Data and Applications Center (SEDAC). https://doi.org/10.7927/H4668B3D.
- Center for Hazards and Risk Research - CHRR - Columbia University, Center for International Earth Science Information Network - CIESIN - Columbia University. 2005. Global Earthquake Hazard Distribution - Peak Ground Acceleration. Palisades, NY: NASA Socioeconomic Data and Applications Center (SEDAC). https://doi.org/10.7927/H4BZ63ZS.
Recent Nearby Earthquakes
Magnitude 3.0 and greater
| Date▼ | Time↕ | Magnitude↕ | Distance↕ | Depth↕ | Location↕ | Link |
|---|---|---|---|---|---|---|
| 5/15/18 | 2:18 AM | 3.45 | 32.3 km | 8,770 m | 3km ENE of Oakland, CA | usgs.gov |
| 9/13/16 | 7:50 AM | 3.54 | 32.3 km | 4,019 m | 3km SE of Piedmont, California | usgs.gov |
| 8/17/15 | 1:49 PM | 4.01 | 35.3 km | 4,690 m | 1km N of Piedmont, California | usgs.gov |
| 7/21/15 | 9:41 AM | 3.98 | 27.4 km | 8,370 m | 3km NNE of Fremont, California | usgs.gov |
| 3/10/15 | 5:07 PM | 3.04 | 27.7 km | 4,677 m | 2km NNE of San Leandro, California | usgs.gov |
| 9/29/11 | 11:47 PM | 3.08 | 29.2 km | 14,458 m | San Francisco Bay area, California | usgs.gov |
| 9/26/11 | 3:08 AM | 3.24 | 27.9 km | 7,859 m | San Francisco Bay area, California | usgs.gov |
| 8/24/11 | 4:57 PM | 3.38 | 27.3 km | 8,632 m | San Francisco Bay area, California | usgs.gov |
| 8/24/11 | 6:36 AM | 3.6 | 27.2 km | 8,092 m | San Francisco Bay area, California | usgs.gov |
| 4/18/11 | 9:57 PM | 3.37 | 17.8 km | 12,307 m | San Francisco Bay area, California | usgs.gov |
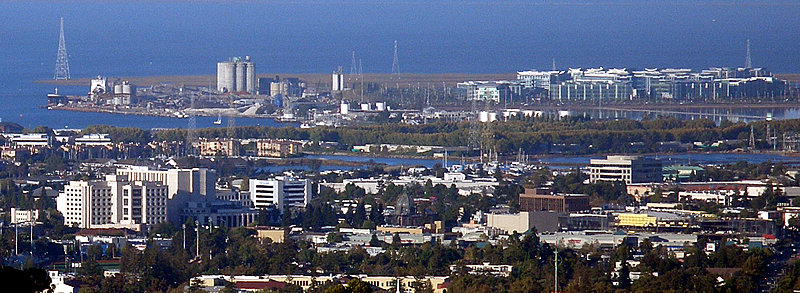
Belmont, California
Belmont is a city in San Mateo County in the U.S. state of California. It is in the San Francisco Bay Area, on the San Francisco Peninsula halfway between San Francisco and San Jose. It was originally part of Rancho de las Pulgas, for which one of it..
Belmont, California Wikipedia Page


About Our Data
The data on this page is estimated using a number of publicly available tools and resources. It is provided without warranty, and could contain inaccuracies. Use at your own risk.