Categories in Burnside, Kentucky
Industries
Business Distribution by Industry in Burnside, Kentucky
| Industry Description | Number of Establishments | Average Age of Business |
|---|---|---|
| Holiday homes, cabins and resorts | 26 | 13 years |
| Restaurants | 23 | 21 years |
| Other accommodation | 16 | 27 years |
| Religion | 16 | 47 years |
| Shopping | 12 | 21 years |
| Gas station | 11 | — |
| Sporting goods | 9 | — |
| Health and medical | 9 | — |
| Construction of buildings | 8 | 40 years |
| Boats | 7 | — |
| Cemeteries and crematoriums | 5 | — |
| Business services | 5 | — |
| Real estate | 5 | — |
| Chiropractors | 5 | — |
| Electronics stores | 5 | — |
Burnside, Kentucky Facts
| Area | 8.9 mi² |
| Population | 870 |
| Male Population | 425 (48.8%) |
| Female Population | 445 (51.2%) |
| Population change (1975 to 2020) | +30.2% |
| Population change (2000 to 2020) | +19.7% |
| Median Age | 44.4 years (Male: 44.1, Female: 44.7) |
| Area Codes | 606 |
| Neighborhoods | Somerset |
| Local Time | |
| Timezone | Eastern Daylight Time |
| Lat & Lng | 36.98897, -84.59994 |
| Zip Codes | 42519 |
Map of Burnside, Kentucky
Interactive Map
Burnside, Kentucky Population
Years 1975 to 2020
| Data | 1975 | 1990 | 2000 | 2015 | 2020 |
|---|---|---|---|---|---|
| Population | 668 | 677 | 727 | 850 | 870 |
| Population Density | 74.8 / mi² | 75.8 / mi² | 81.4 / mi² | 95.2 / mi² | 97.4 / mi² |
Burnside, Kentucky Population change from 2000 to 2015
Increase of 16.9% from year 2000 to 2015
| Location | Change since 1975 | Change since 1990 | Change since 2000 |
|---|---|---|---|
| Burnside, Kentucky | +27.2% | +25.6% | +16.9% |
| Kentucky | +37.1% | +20.9% | +9.9% |
| United States | +46.9% | +27.2% | +13.7% |
Burnside, Kentucky Median Age
Median Age: 44.4 years
| Location | Median Age | Median Age (Female) | Median Age (Male) |
|---|---|---|---|
| Burnside, Kentucky | 44.4 yrs | 44.7 yrs | 44.1 yrs |
| Kentucky | 38 yrs | 39.3 yrs | 36.7 yrs |
| United States | 37.4 yrs | 38.7 yrs | 36.1 yrs |
Burnside, Kentucky Population Density
Population Density: 97.4 / mi²
| Location | Population | Area | Density |
|---|---|---|---|
| Burnside, Kentucky | 870 | 8.93 sq mi | 97.4 / mi² |
| Kentucky | 4.5 million | 40,407.8 sq mi | 111 / mi² |
| United States | 321.6 million | 3,796,740.8 sq mi | 84.7 / mi² |
Burnside, Kentucky Historical and Projected Population
Estimated Population from 1800 to 2100
- JRC (European Commission's Joint Research Centre) work on the GHS built-up grid
- CIESIN (Center for International Earth Science Information Network)
- [Link] Klein Goldewijk, K., Beusen, A., Doelman, J., and Stehfest, E.: Anthropogenic land use estimates for the Holocene – HYDE 3.2, Earth Syst. Sci. Data, 9, 927–953, https://doi.org/10.5194/essd-9-927-2017, 2017.
Price Distribution
Business distribution by price for Burnside, Kentucky
Human Development Index (HDI)
Statistic composite index of life expectancy, education, and per capita income.
Burnside, Kentucky CO2 Emissions
Carbon Dioxide (CO2) Emissions Per Capita in Tonnes Per Year
| Location | CO2 Emissions | CO2 Emissions Per Capita | CO2 Emissions Intensity |
|---|---|---|---|
| Burnside, Kentucky | 18,022 tn | 20.71 tn | 2,018.5 tons/mi² |
| Kentucky | 80,701,118 tn | 18.06 tn | 1,997.2 tons/mi² |
| United States | 5,664,619,810 tn | 17.62 tn | 1,492 tons/mi² |
| 2013 CO2 emissions (tonnes/year) | 18,022 tn |
| 2013 CO2 emissions (tonnes/year) per capita | 20.71 tn |
| 2013 CO2 emissions intensity (tonnes/mi²/year) | 2,018.5 tons/mi² |
Natural Hazards Risk
Relative risk out of 10
| Hazard | Risk Level |
|---|---|
| Flood | High (8) |
| Earthquake | Low (2) |
* Risk, particularly concerning flood or landslide, may not be for the entire area.
- Dilley, M., R.S. Chen, U. Deichmann, A.L. Lerner-Lam, M. Arnold, J. Agwe, P. Buys, O. Kjekstad, B. Lyon, and G. Yetman. 2005. Natural Disaster Hotspots: A Global Risk Analysis. Washington, D.C.: World Bank. https://doi.org/10.1596/0-8213-5930-4.
- Center for Hazards and Risk Research - CHRR - Columbia University, Center for International Earth Science Information Network - CIESIN - Columbia University. 2005. Global Flood Hazard Frequency and Distribution. Palisades, NY: NASA Socioeconomic Data and Applications Center (SEDAC). https://doi.org/10.7927/H4668B3D.
- Center for Hazards and Risk Research - CHRR - Columbia University, Center for International Earth Science Information Network - CIESIN - Columbia University. 2005. Global Earthquake Hazard Distribution - Peak Ground Acceleration. Palisades, NY: NASA Socioeconomic Data and Applications Center (SEDAC). https://doi.org/10.7927/H4BZ63ZS.
Recent Nearby Earthquakes
Magnitude 3.0 and greater
| Date▼ | Time↕ | Magnitude↕ | Distance↕ | Depth↕ | Location↕ | Link |
|---|---|---|---|---|---|---|
| 1/27/09 | 11:20 AM | 3.2 | 48.2 km | 26,080 m | 4km NE of Williamsburg, Kentucky | usgs.gov |
| 9/17/04 | 3:21 PM | 3.7 | 53.4 km | 1,290 m | 8km ESE of Corbin, Kentucky | usgs.gov |
| 1/17/99 | 6:38 PM | 3 | 82.4 km | 5,000 m | eastern Kentucky | usgs.gov |
| 8/28/83 | 10:45 PM | 3.1 | 75.2 km | 5,000 m | eastern Kentucky | usgs.gov |
| 1/19/76 | 6:20 AM | 4 | 70 km | 5,000 m | eastern Kentucky | usgs.gov |
| 9/7/56 | 1:35 PM | 4.1 | 94.4 km | 5,000 m | eastern Tennessee | usgs.gov |
| 1/2/54 | 3:25 AM | 4.3 | 91.2 km | — | eastern Kentucky | usgs.gov |
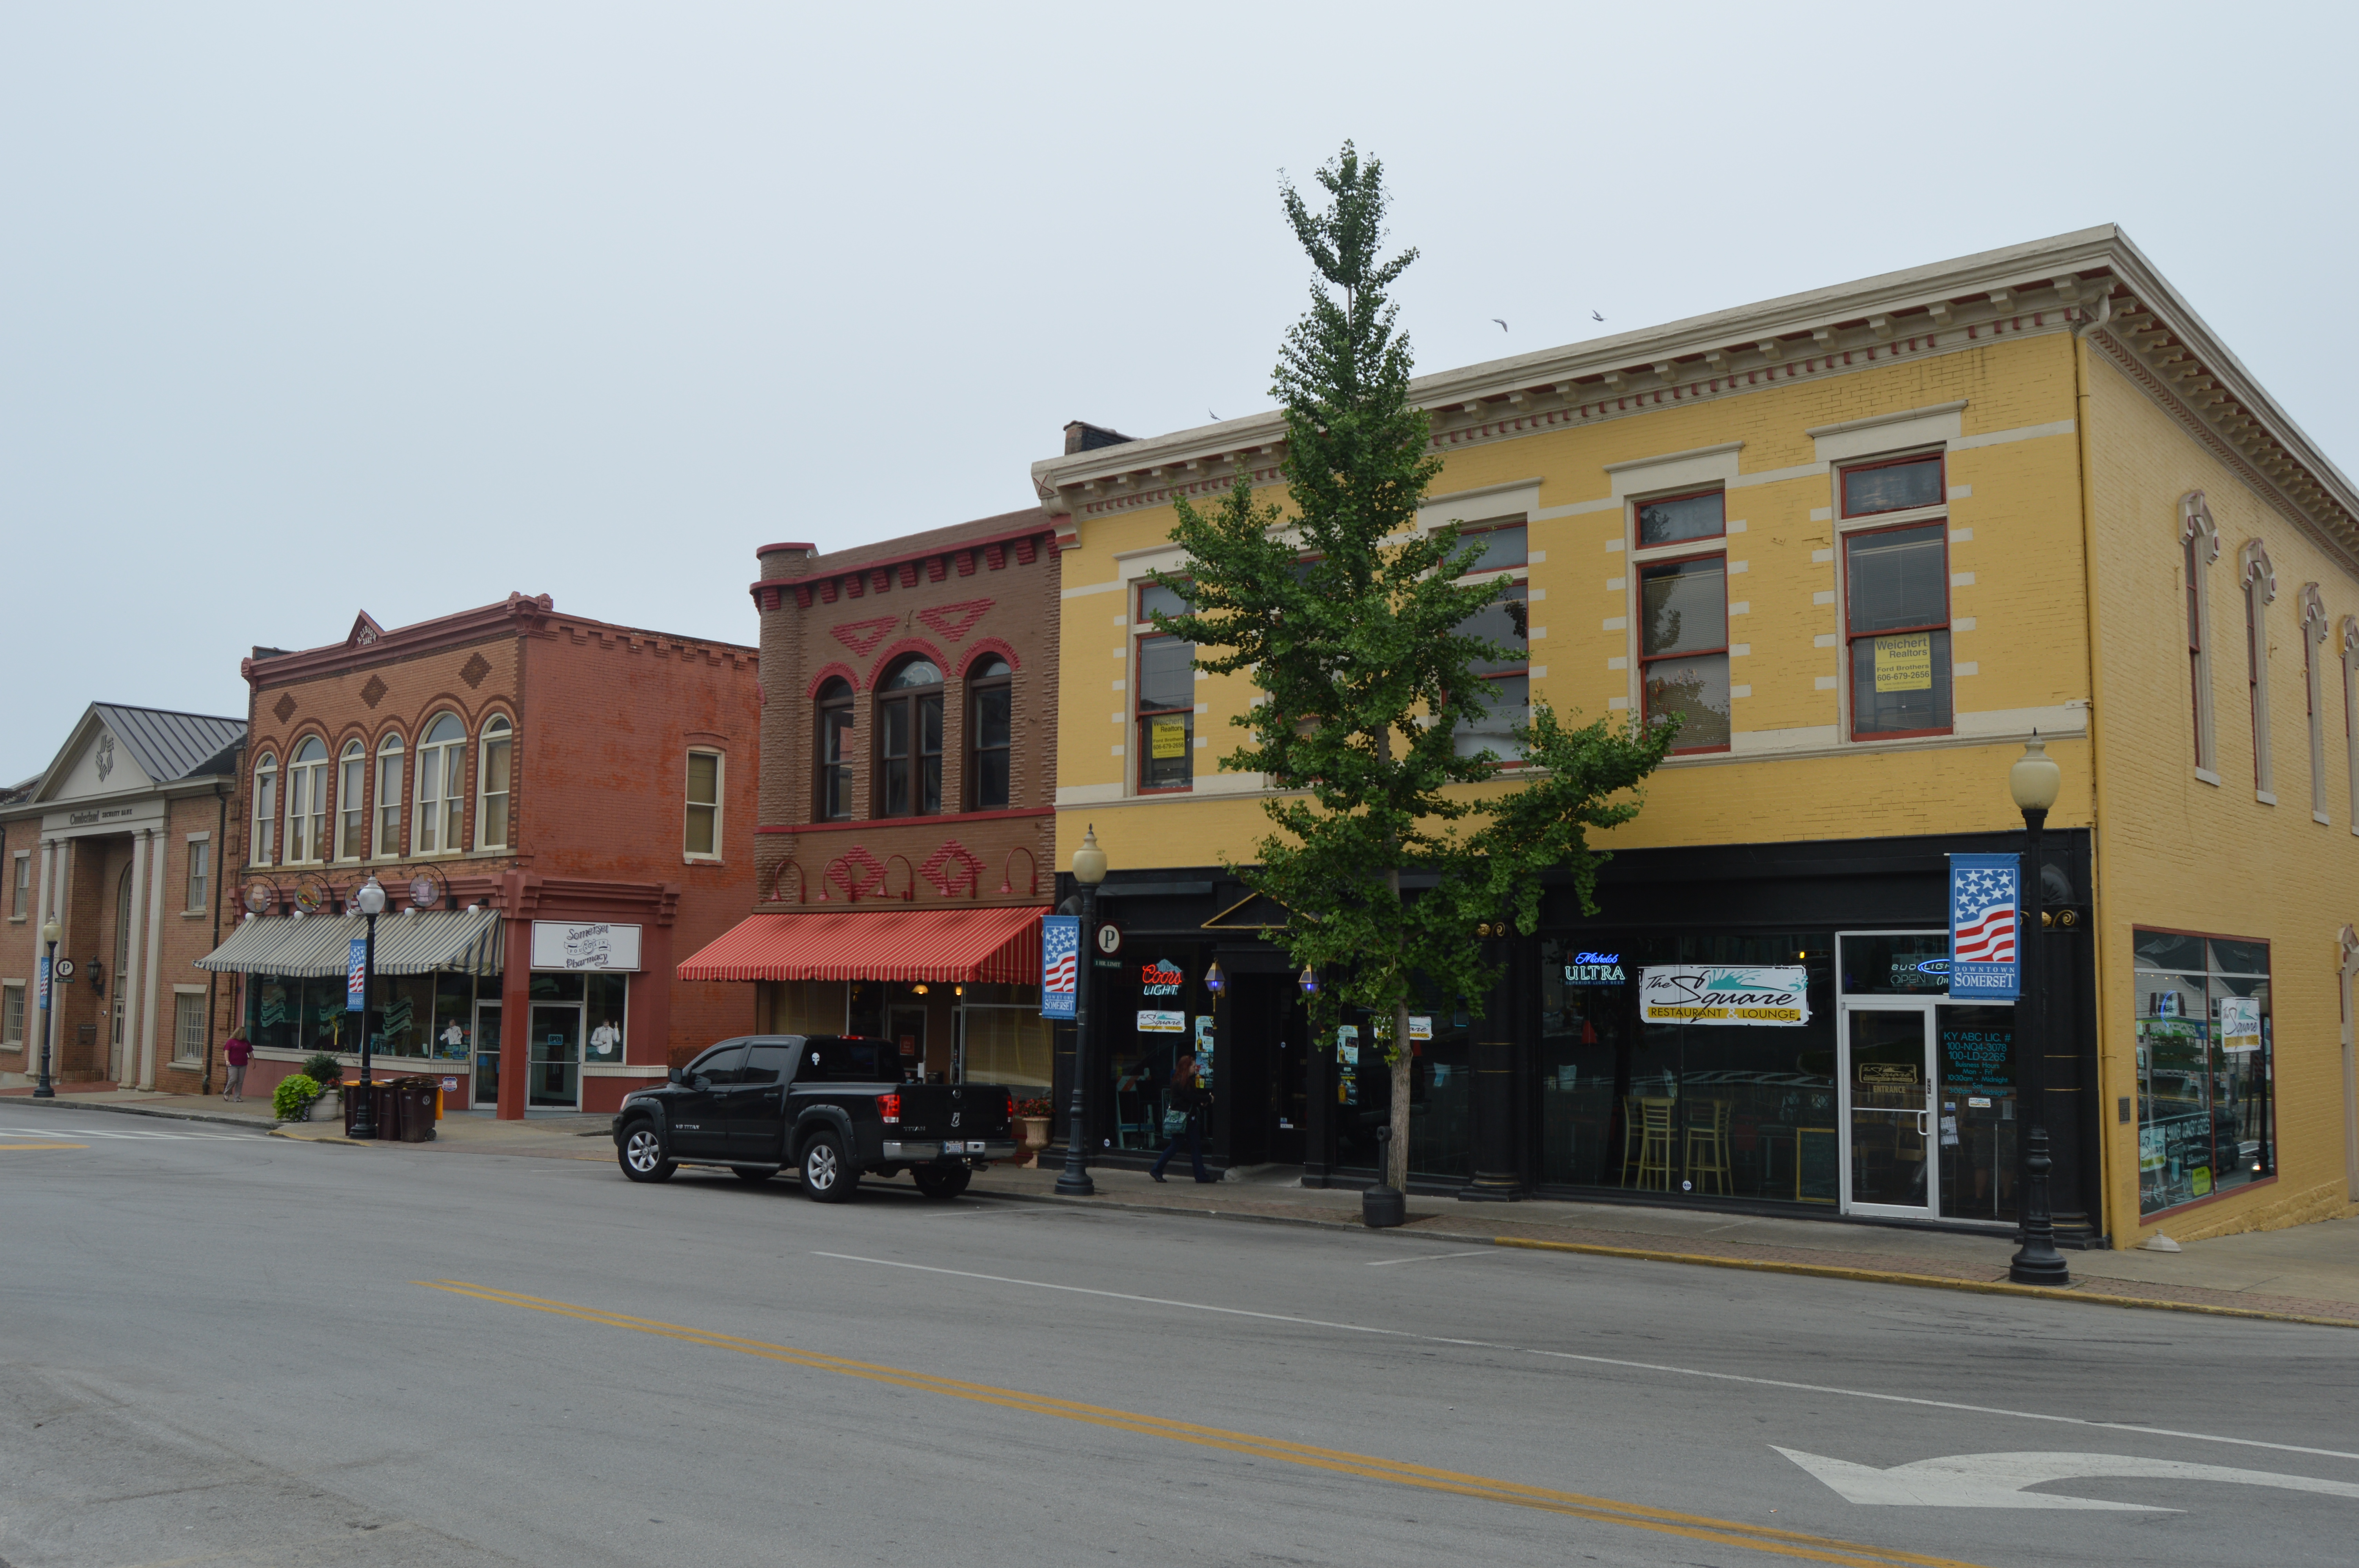
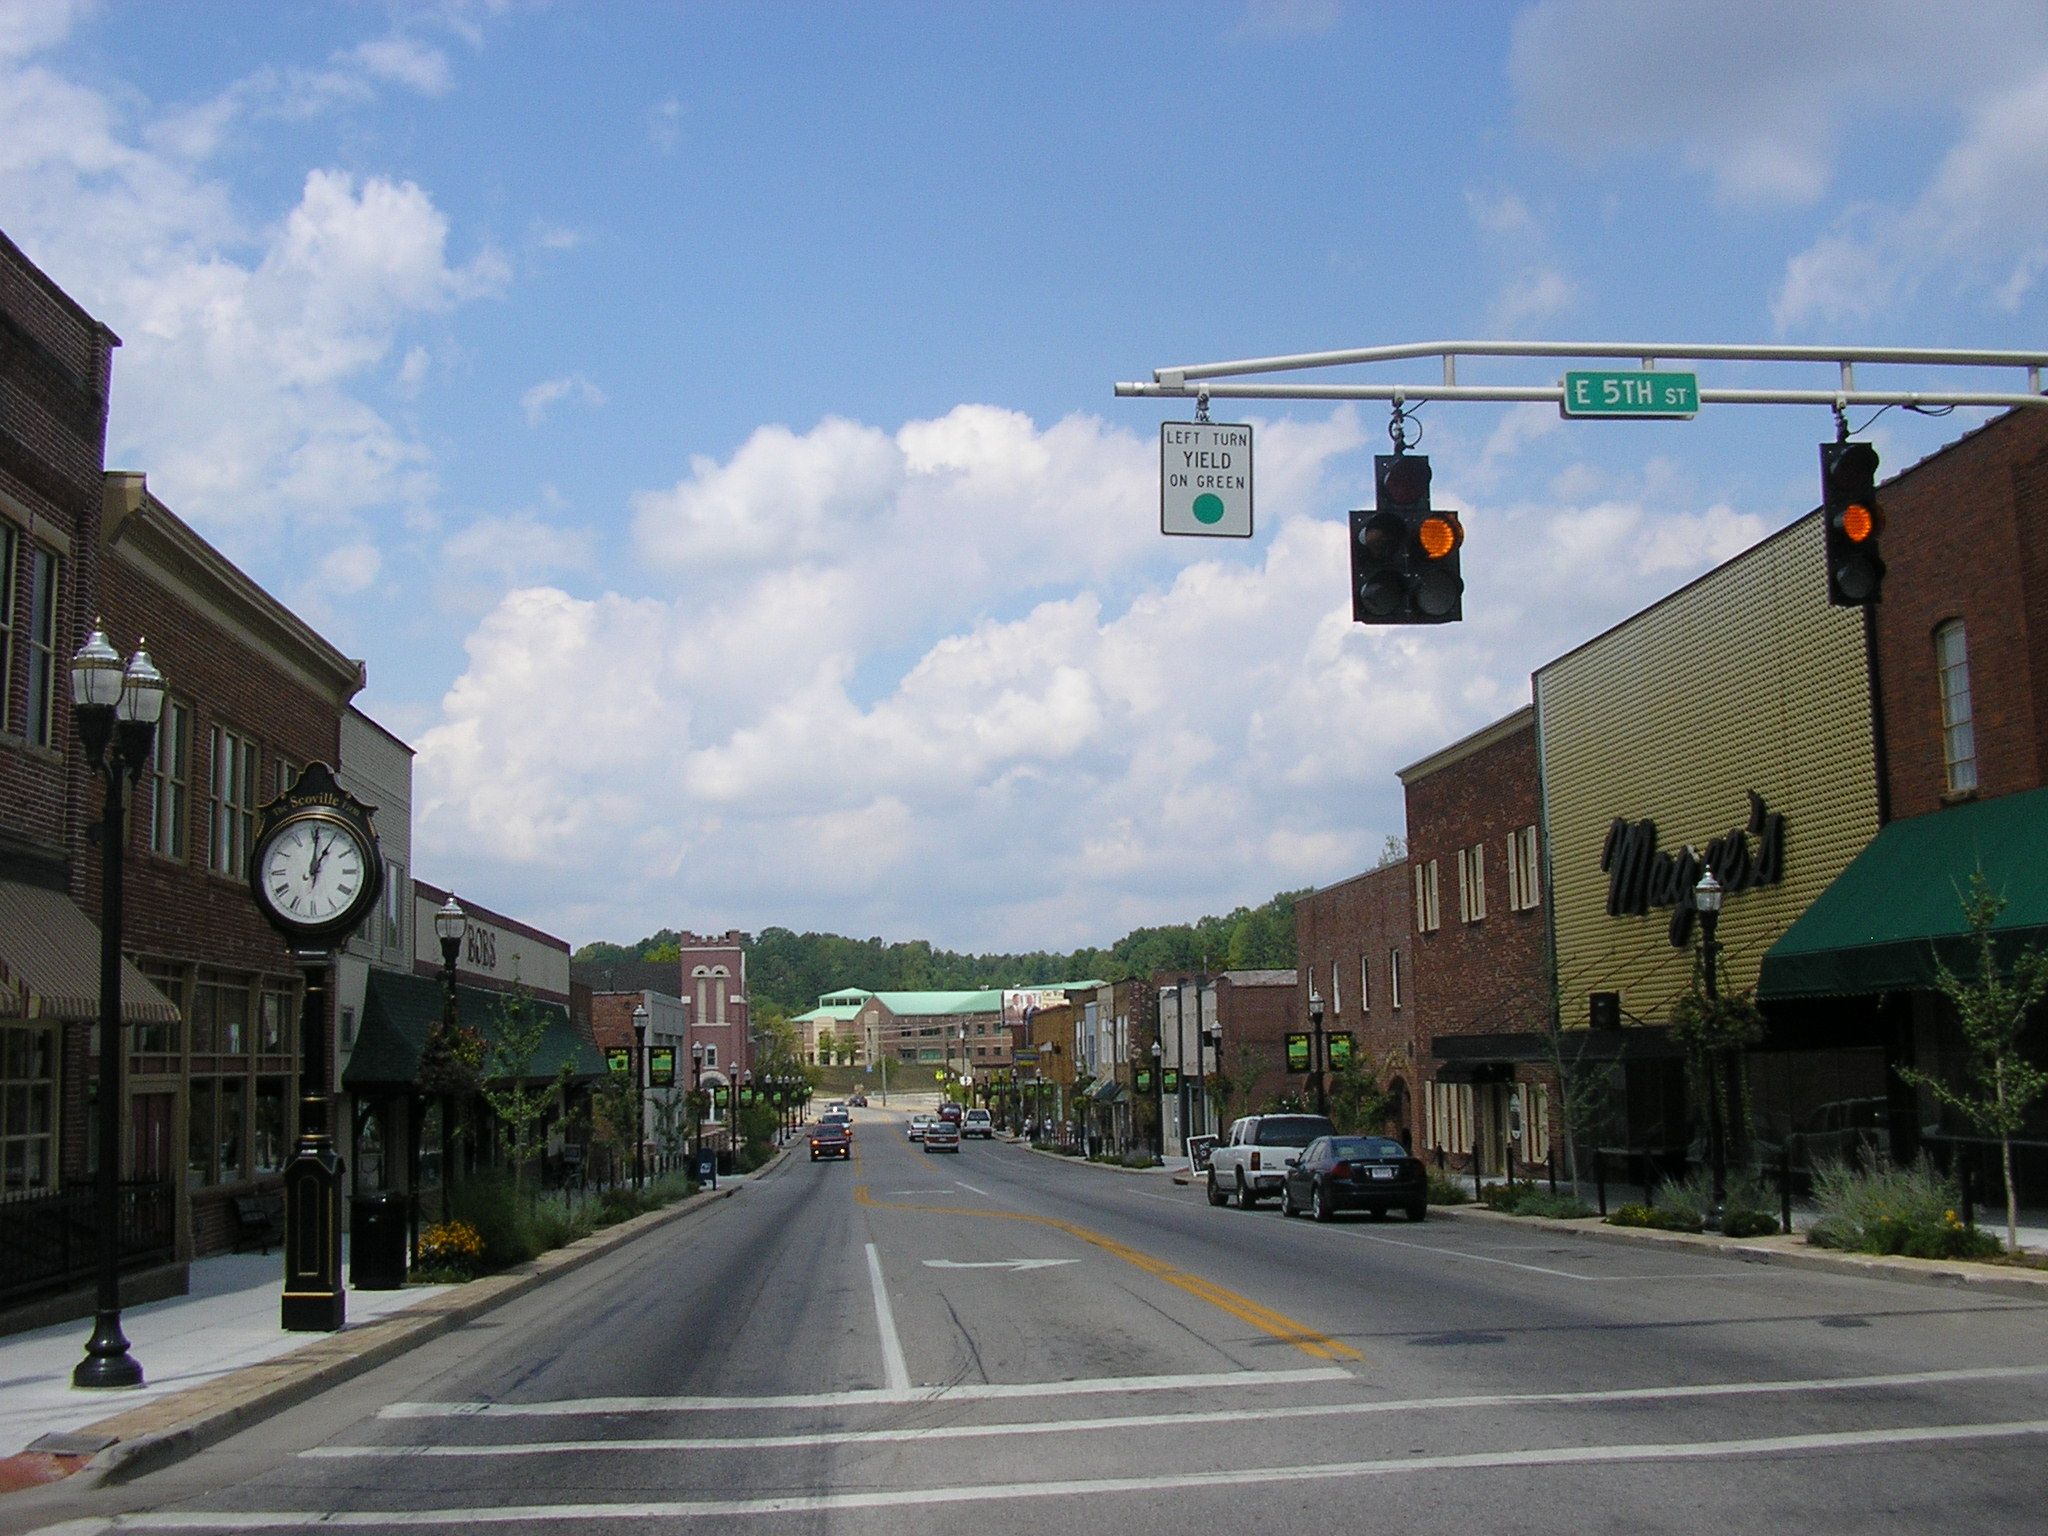
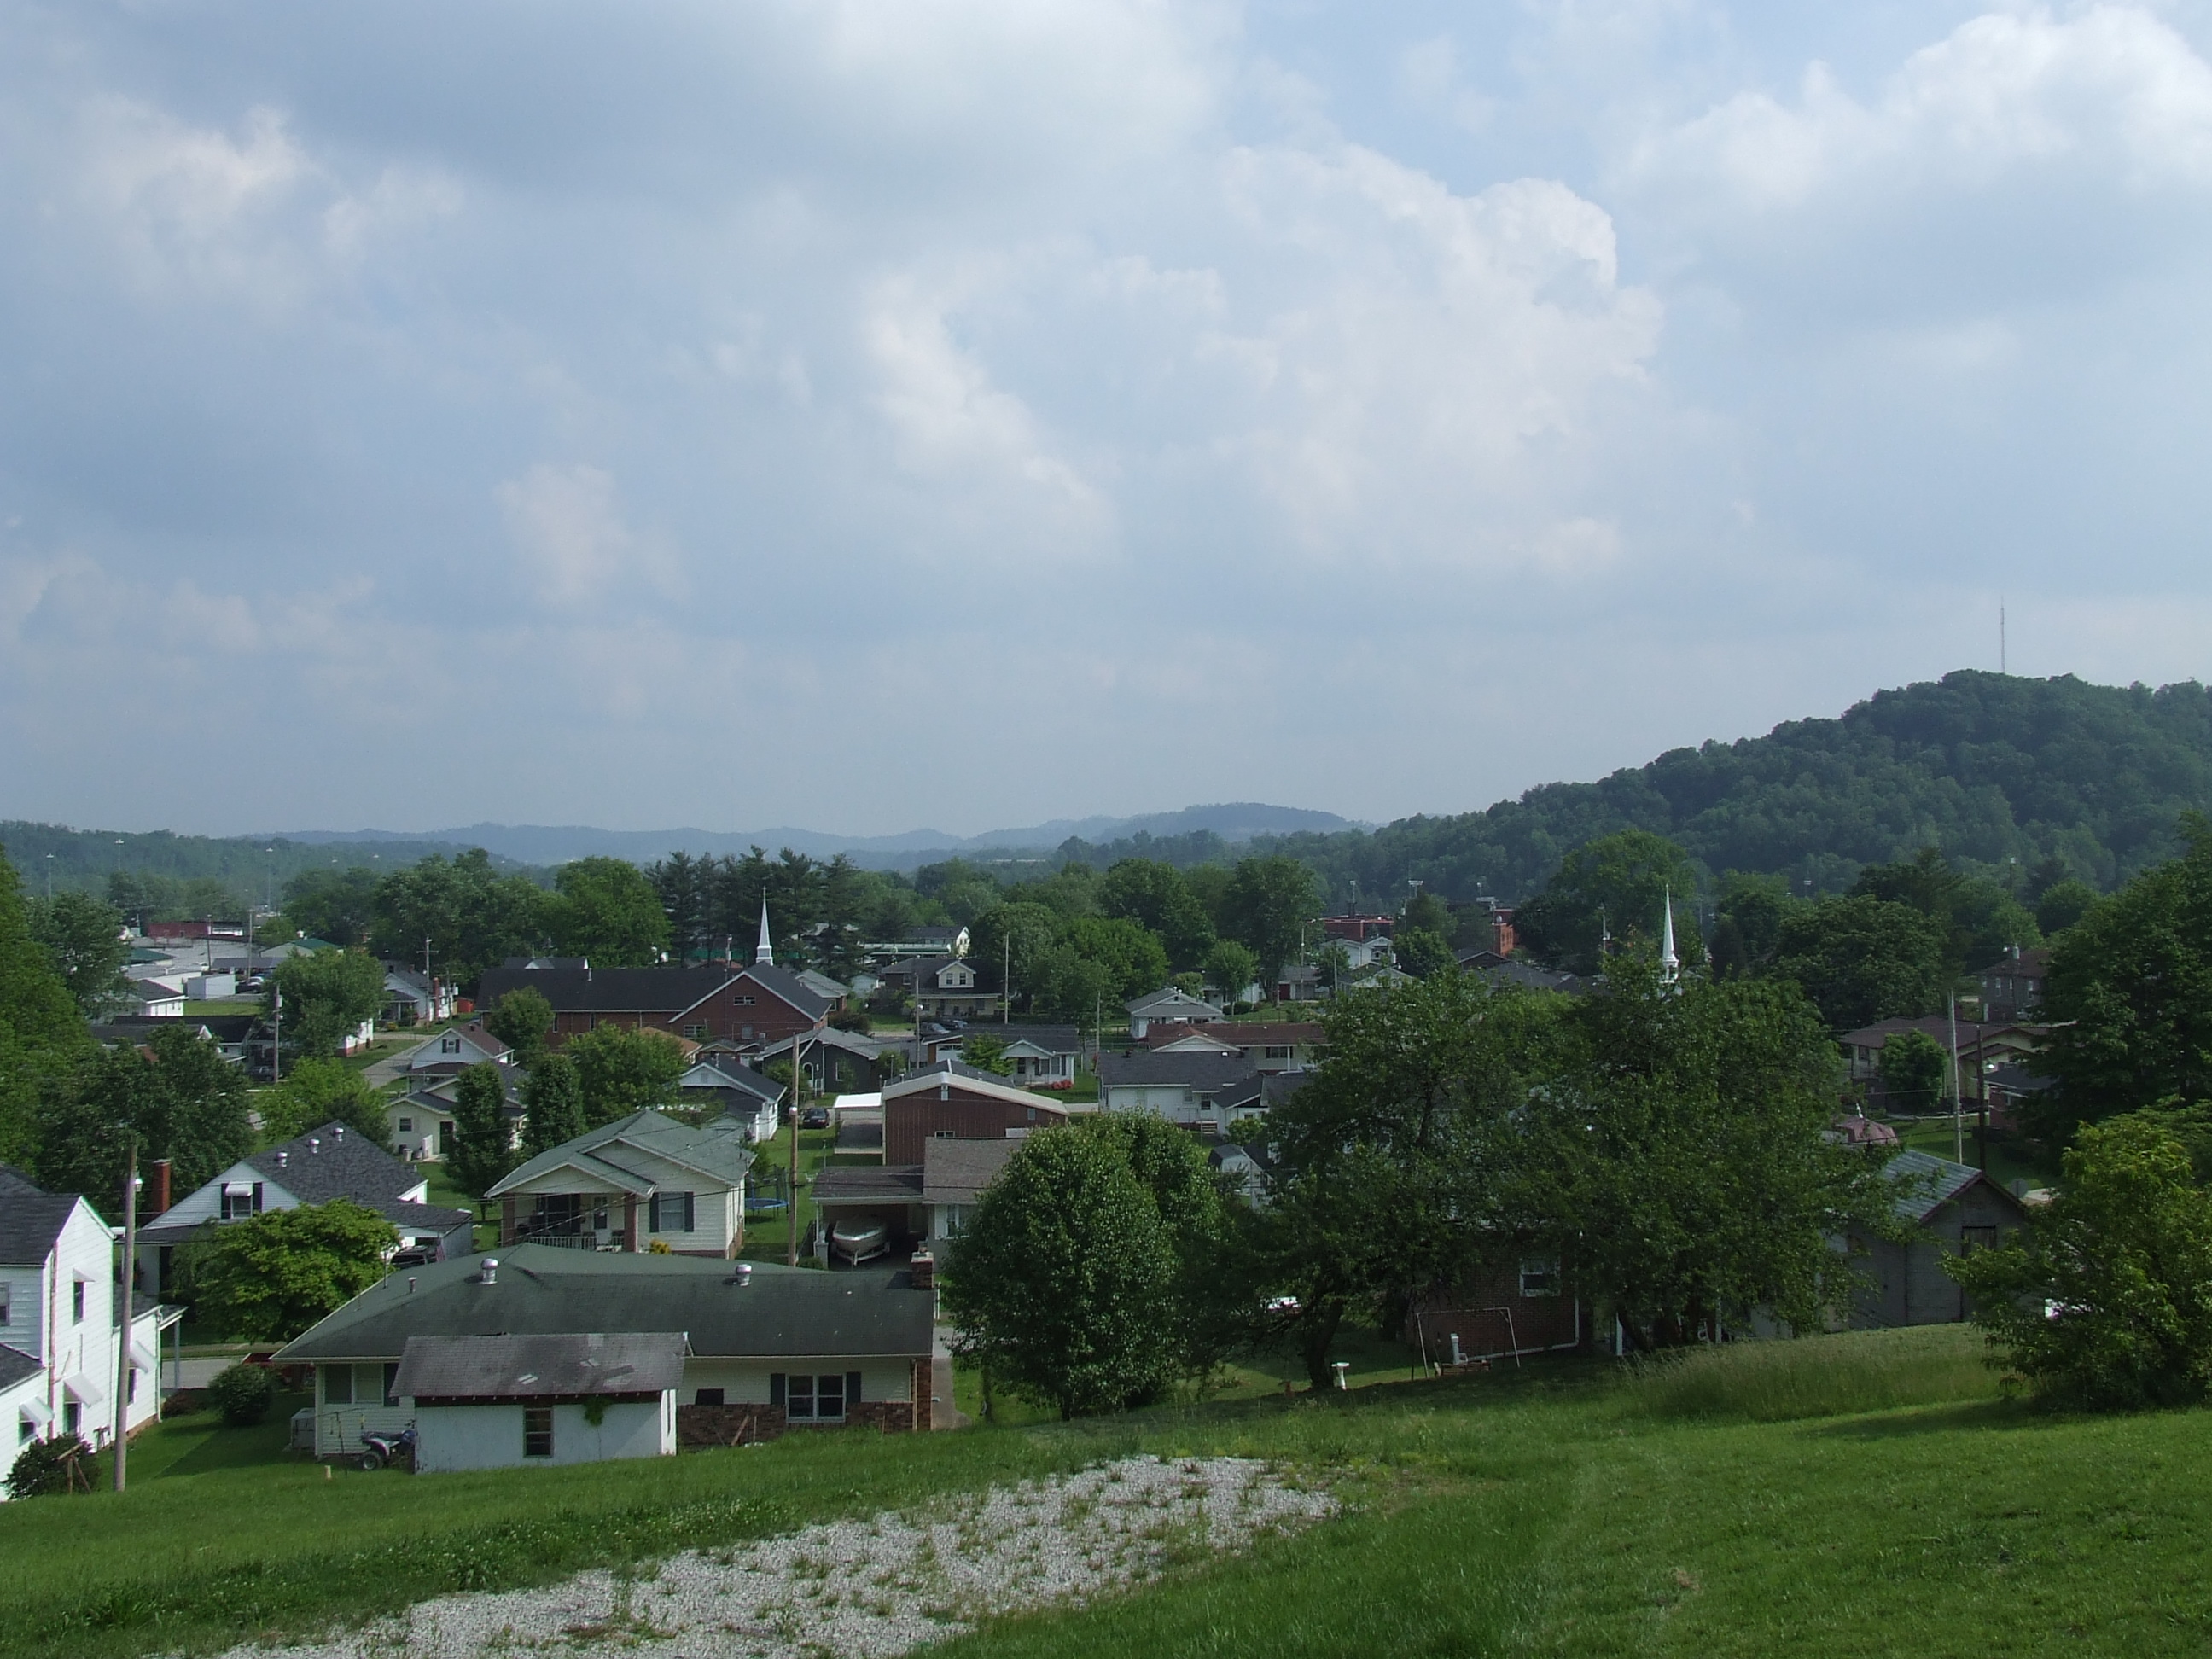
Burnside, Kentucky
Burnside is a 4th-class city in Pulaski County, Kentucky, in the United States. The population was 637 at the 2000 census. In 2004, Burnside became the only town in Pulaski County or any adjoining county to allow the sale of alcoholic beverages in qu..
Burnside, Kentucky Wikipedia Page
About Our Data
The data on this page is estimated using a number of publicly available tools and resources. It is provided without warranty, and could contain inaccuracies. Use at your own risk.