Categories in Cactus, Texas
Industries
Business Distribution by Industry in Cactus, Texas
| Industry Description | Number of Establishments |
|---|---|
| Restaurants | 11 |
Cactus, Texas Facts
| Area | 2.1 mi² |
| Population | 3,168 |
| Male Population | 1,797 (56.7%) |
| Female Population | 1,371 (43.3%) |
| Population change (1975 to 2020) | +164.7% |
| Population change (2000 to 2020) | +13.1% |
| Median Age | 25.1 years (Male: 25.3, Female: 24.8) |
| Area Codes | 806 |
| Local Time | |
| Timezone | Central Daylight Time |
| Lat & Lng | 36.05226, -102.00240 |
| Zip Codes | 79013 |
Map of Cactus, Texas
Interactive Map
Cactus, Texas Population
Years 1975 to 2020
| Data | 1975 | 1990 | 2000 | 2015 | 2020 |
|---|---|---|---|---|---|
| Population | 1,197 | 2,060 | 2,802 | 3,135 | 3,168 |
| Population Density | 557.3 / mi² | 959.2 / mi² | 1,304.7 / mi² | 1,459.7 / mi² | 1,475.1 / mi² |
Cactus, Texas Population change from 2000 to 2015
Increase of 11.9% from year 2000 to 2015
| Location | Change since 1975 | Change since 1990 | Change since 2000 |
|---|---|---|---|
| Cactus, Texas | +161.9% | +52.2% | +11.9% |
| Texas | +111% | +60.8% | +31.3% |
| United States | +46.9% | +27.2% | +13.7% |
Cactus, Texas Median Age
Median Age: 25.1 years
| Location | Median Age | Median Age (Female) | Median Age (Male) |
|---|---|---|---|
| Cactus, Texas | 25.1 yrs | 24.8 yrs | 25.3 yrs |
| Texas | 33.8 yrs | 34.8 yrs | 32.8 yrs |
| United States | 37.4 yrs | 38.7 yrs | 36.1 yrs |
Cactus, Texas Population Density
Population Density: 1,475 / mi²
| Location | Population | Area | Density |
|---|---|---|---|
| Cactus, Texas | 3,168 | 2.148 sq mi | 1,475 / mi² |
| Texas | 27.5 million | 268,596.2 sq mi | 103 / mi² |
| United States | 321.6 million | 3,796,740.8 sq mi | 84.7 / mi² |
Cactus, Texas Historical and Projected Population
Estimated Population from 1860 to 2100
- JRC (European Commission's Joint Research Centre) work on the GHS built-up grid
- CIESIN (Center for International Earth Science Information Network)
- [Link] Klein Goldewijk, K., Beusen, A., Doelman, J., and Stehfest, E.: Anthropogenic land use estimates for the Holocene – HYDE 3.2, Earth Syst. Sci. Data, 9, 927–953, https://doi.org/10.5194/essd-9-927-2017, 2017.
Human Development Index (HDI)
Statistic composite index of life expectancy, education, and per capita income.
Cactus, Texas CO2 Emissions
Carbon Dioxide (CO2) Emissions Per Capita in Tonnes Per Year
| Location | CO2 Emissions | CO2 Emissions Per Capita | CO2 Emissions Intensity |
|---|---|---|---|
| Cactus, Texas | 41,996 tn | 13.26 tn | 19,553.8 tons/mi² |
| Texas | 488,896,034 tn | 17.76 tn | 1,820.2 tons/mi² |
| United States | 5,664,619,810 tn | 17.62 tn | 1,492 tons/mi² |
| 2013 CO2 emissions (tonnes/year) | 41,996 tn |
| 2013 CO2 emissions (tonnes/year) per capita | 13.26 tn |
| 2013 CO2 emissions intensity (tonnes/mi²/year) | 19,553.8 tons/mi² |
Natural Hazards Risk
Relative risk out of 10
| Hazard | Risk Level |
|---|---|
| Drought | High (9) |
* Risk, particularly concerning flood or landslide, may not be for the entire area.
- Dilley, M., R.S. Chen, U. Deichmann, A.L. Lerner-Lam, M. Arnold, J. Agwe, P. Buys, O. Kjekstad, B. Lyon, and G. Yetman. 2005. Natural Disaster Hotspots: A Global Risk Analysis. Washington, D.C.: World Bank. https://doi.org/10.1596/0-8213-5930-4.
- Center for Hazards and Risk Research - CHRR - Columbia University, Center for International Earth Science Information Network - CIESIN - Columbia University, and International Research Institute for Climate and Society - IRI - Columbia University. 2005. Global Drought Hazard Frequency and Distribution. Palisades, NY: NASA Socioeconomic Data and Applications Center (SEDAC). https://doi.org/10.7927/H4VX0DFT.
Recent Nearby Earthquakes
Magnitude 3.0 and greater
| Date▼ | Time↕ | Magnitude↕ | Distance↕ | Depth↕ | Location↕ | Link |
|---|---|---|---|---|---|---|
| 10/20/18 | 1:04 PM | 3.7 | 85.3 km | 5,000 m | 11km NNE of Amarillo, Texas | usgs.gov |
| 2/2/15 | 12:39 AM | 3.1 | 88.4 km | 4,140 m | 15km ENE of Amarillo, Texas | usgs.gov |
| 8/12/12 | 12:36 AM | 3.3 | 76 km | 5,000 m | Texas Panhandle region | usgs.gov |
| 2/4/10 | 9:41 AM | 3.3 | 84.2 km | 2,000 m | Texas Panhandle region | usgs.gov |
| 3/28/06 | 11:55 PM | 3 | 77.4 km | 5,000 m | Texas Panhandle region | usgs.gov |
| 2/18/06 | 5:49 AM | 3.5 | 46.2 km | 5,000 m | Texas Panhandle region | usgs.gov |
| 9/24/03 | 3:02 PM | 3.3 | 89.2 km | 5,000 m | Texas Panhandle region | usgs.gov |
| 12/16/00 | 10:08 PM | 3.9 | 74.7 km | 5,000 m | Texas Panhandle region | usgs.gov |
| 8/17/00 | 1:08 AM | 3.9 | 75.4 km | 5,000 m | Texas Panhandle region | usgs.gov |
| 8/10/00 | 1:39 PM | 3 | 75.3 km | 5,000 m | Texas Panhandle region | usgs.gov |
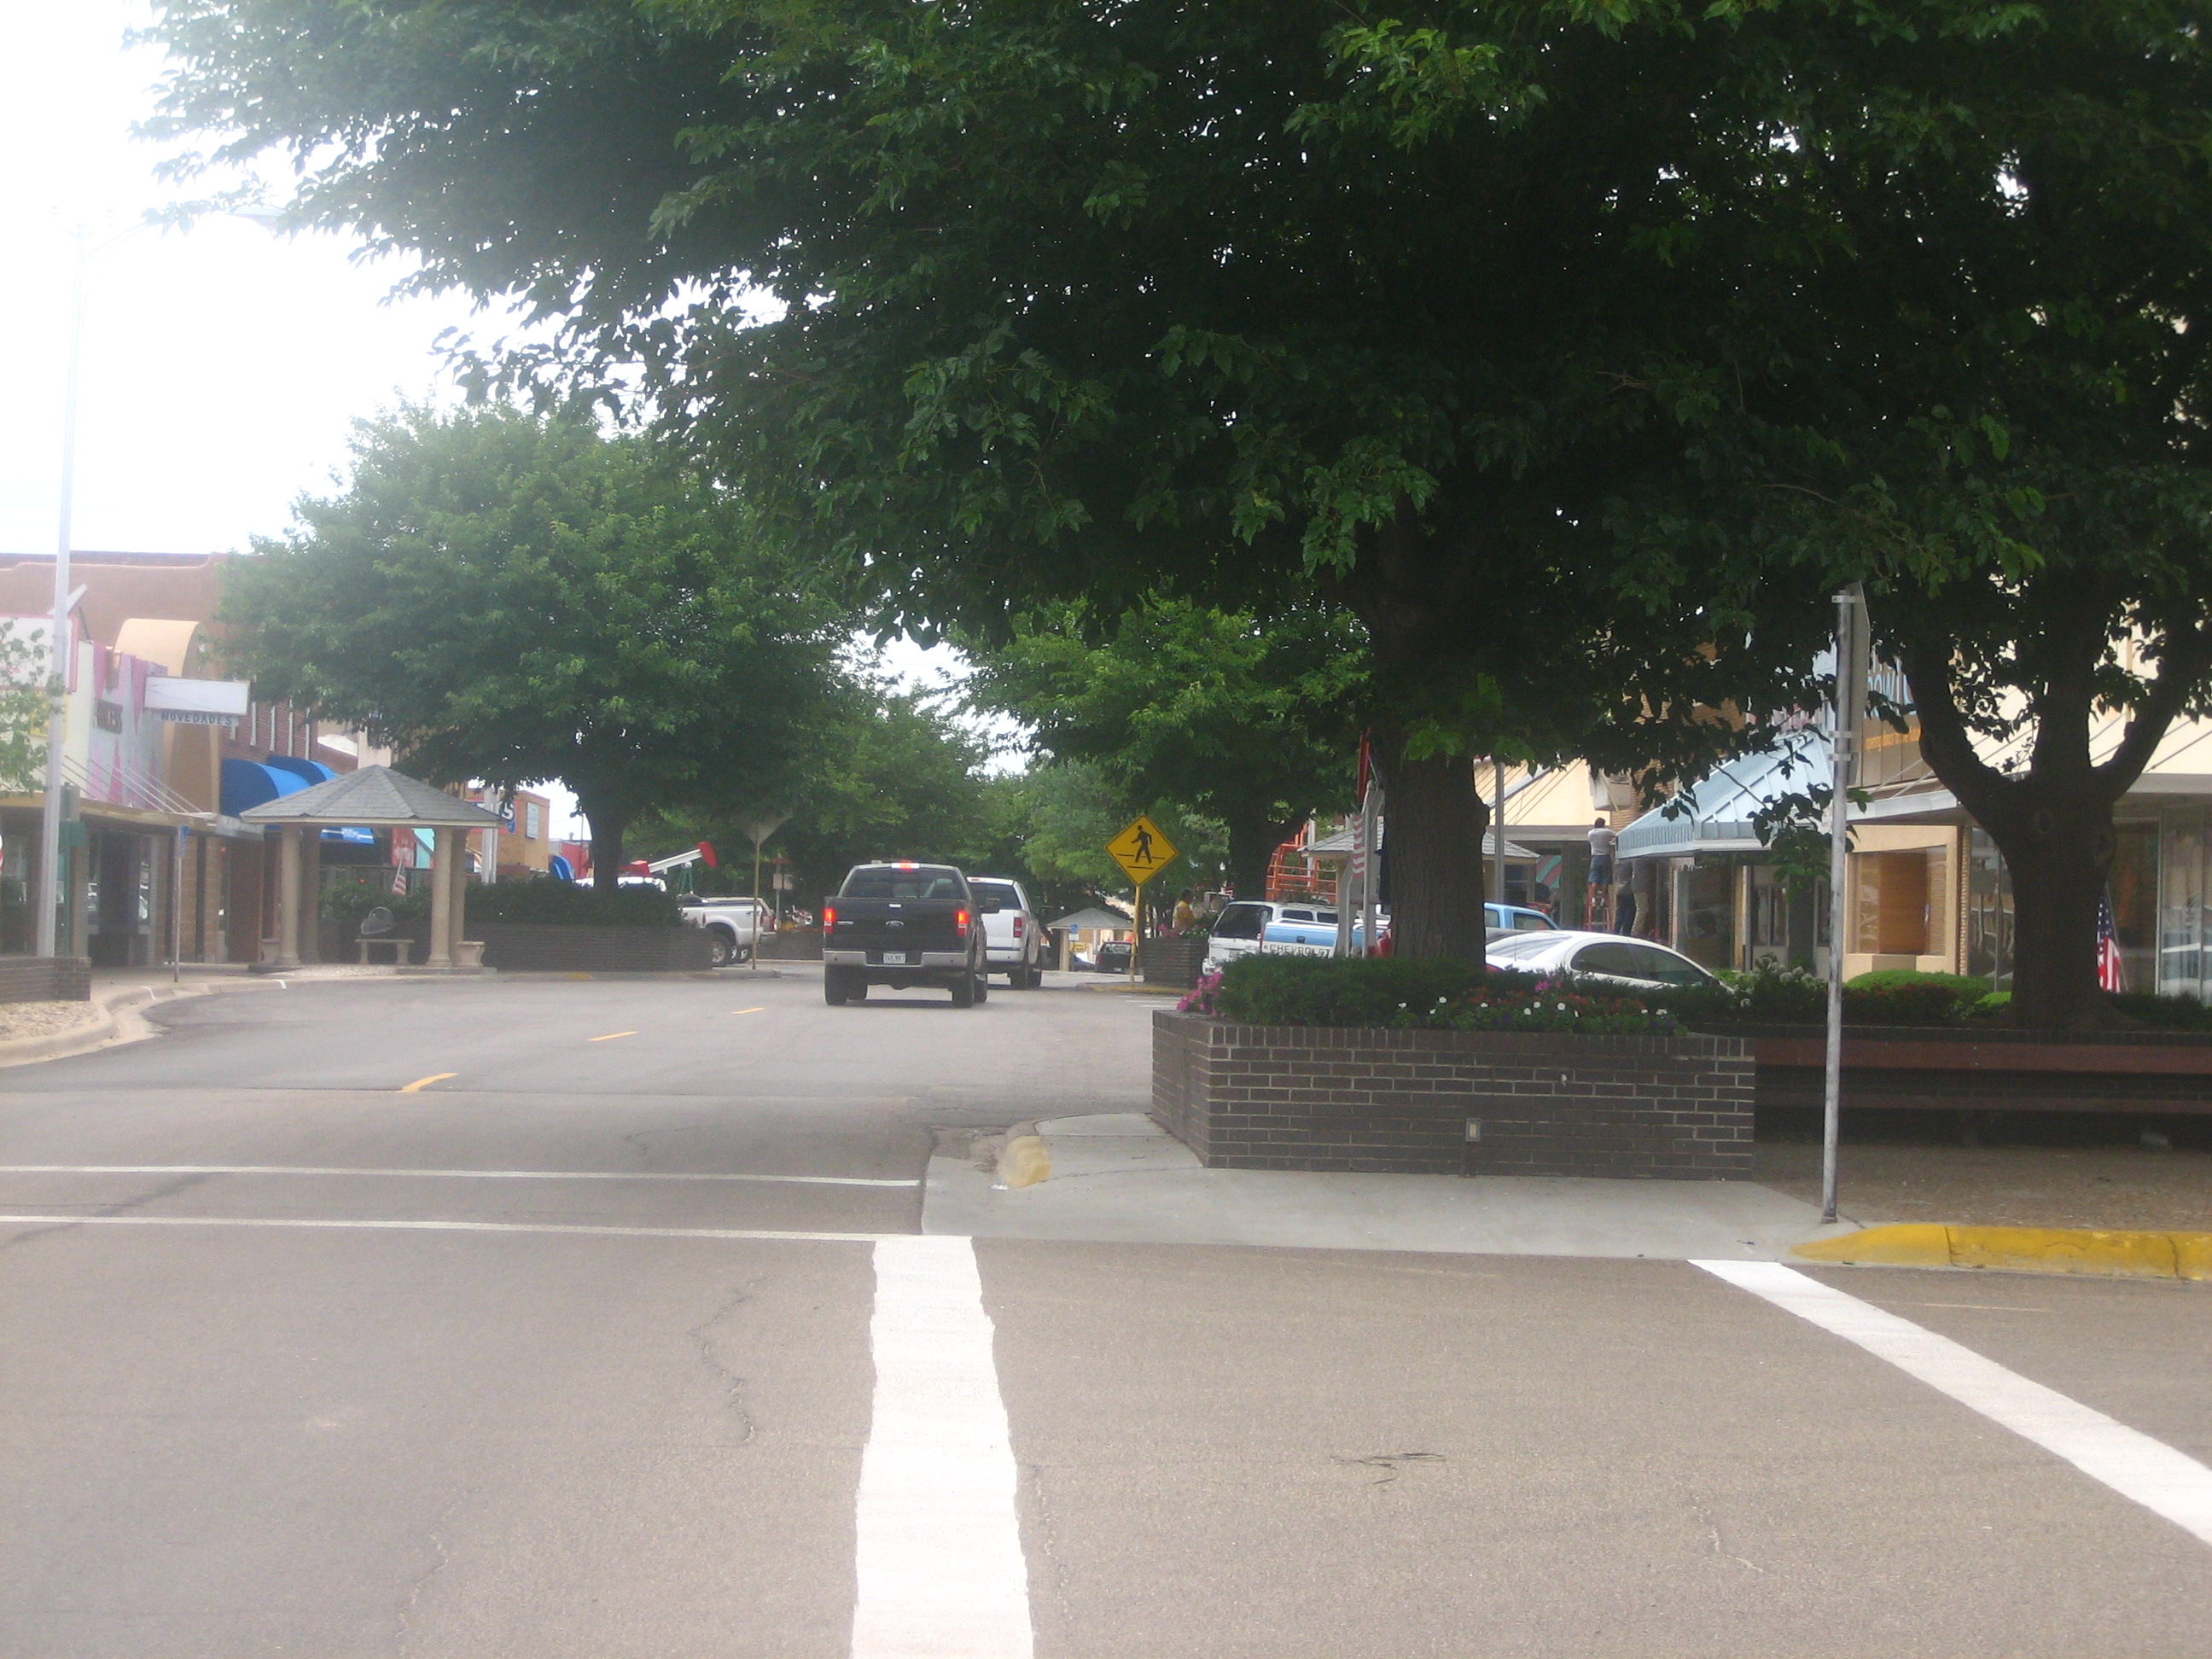
Cactus, Texas
Cactus is a city in Moore County, Texas, United States, along U.S. Route 287. The population was 2,538 at the 2000 census. "Cactus Texas", a song by Waylon Jennings, is a sketch of Cactus in more innocent days [2].
Cactus, Texas Wikipedia Page

About Our Data
The data on this page is estimated using a number of publicly available tools and resources. It is provided without warranty, and could contain inaccuracies. Use at your own risk.