- World
- »
- US
- »
- Indiana
- »
- Freelandville, Indiana
Businesses in Freelandville, Indiana
Industries
Business Distribution by Industry Medical: 20.7%
Shopping: 13.8%
Professional Services: 13.8%
Home Services: 10.3%
Industry: 6.9%
Automotive: 6.9%
Restaurants: 6.9%
Local Services: 6.9%
Financial Services: 6.9%
Community & Government: 6.9%
| Area of Freelandville, Indiana | 5.57 sq mi |
| Population | 630 |
| Male Population | 301 (47.8%) |
| Female Population | 329 (52.2%) |
| Population change from 1975 to 2015 | +48.9% |
| Population change from 2000 to 2015 | -4.7% |
| Median Age | 44.6 |
| Male Median Age | 40.6 |
| Female Median Age | 48.2 |
| Area Codes | 812 |
| Local Time | Tuesday 8:29 AM |
| Timezone | Eastern Daylight Time |
| Lat & Lng | 38.86477° / -87.30585° |
| Zip Codes | 47535 |
Freelandville, Indiana - Map
Freelandville, Indiana Population
Years 1975 to 2015| Data | 1975 | 1990 | 2000 | 2015 |
|---|---|---|---|---|
| Population | 423 | 538 | 661 | 630 |
| Population Density | 75.9 / mi² | 96.6 / mi² | 118.7 / mi² | 113.1 / mi² |
Freelandville, Indiana Population change from 2000 to 2015
Decrease of 4.7% from year 2000 to 2015| Location | Change since 1975 | Change since 1990 | Change since 2000 |
|---|---|---|---|
| Freelandville, Indiana | +48.9% | +17.1% | -4.7% |
| Indiana | +33.4% | +18.8% | +8.8% |
| United States | +46.9% | +27.2% | +13.7% |
Freelandville, Indiana Median Age
Median Age: 44.6 years| Location | Median Age | Median Age (Female) | Median Age (Male) |
|---|---|---|---|
| Freelandville, Indiana | 44.6 years | 48.2 years | 40.6 years |
| Indiana | 37 years | 38.2 years | 35.8 years |
| United States | 37.4 years | 38.7 years | 36.1 years |
Freelandville, Indiana Population Tree
Population By Age and Gender| Age | Male | Female | Total |
|---|---|---|---|
| Under 5 | 14 | 23 | 38 |
| 5-9 | 23 | 14 | 37 |
| 10-14 | 13 | 17 | 30 |
| 15-19 | 17 | 19 | 36 |
| 20-24 | 20 | 18 | 38 |
| 25-29 | 23 | 19 | 43 |
| 30-34 | 19 | 13 | 33 |
| 35-39 | 19 | 15 | 35 |
| 40-44 | 13 | 15 | 28 |
| 45-49 | 20 | 19 | 40 |
| 50-54 | 20 | 17 | 37 |
| 55-59 | 24 | 23 | 48 |
| 60-64 | 18 | 22 | 41 |
| 65-69 | 19 | 26 | 45 |
| 70-74 | 13 | 15 | 29 |
| 75-79 | 11 | 20 | 31 |
| 80-84 | 6 | 14 | 20 |
| 85 Plus | 8 | 21 | 30 |
Freelandville, Indiana Population Density
Population Density: 113.1 / mi²| Location | Population | Area | Population Density |
|---|---|---|---|
| Freelandville, Indiana | 630 | 5.57 sq mi | 113.1 / mi² |
| Indiana | 6.6 million | 36,419.7 sq mi | 182.5 / mi² |
| United States | 321.6 million | 3,796,761.2 sq mi | 84.7 / mi² |
Human Development Index (HDI)
Statistic composite index of life expectancy, education, and per capita income.Sources: [Link] Kummu, M., Taka, M. & Guillaume, J. Gridded global datasets for Gross Domestic Product and Human Development Index over 1990–2015. Sci Data 5, 180004 (2018) doi:10.1038/sdata.2018.4
Freelandville, Indiana CO2 Emissions
Carbon Dioxide (CO2) Emissions Per Capita in Tonnes Per Year| Location | CO2 Emissions | CO2 Emissions Per Capita | CO2 Emissions Intensity |
|---|---|---|---|
| Freelandville, Indiana | 12,768 tn | 20.3 tn | 2,292 tons/mi² |
| Indiana | 127,126,225 tn | 19.1 tn | 3,490 tons/mi² |
| United States | 5,664,619,809 tn | 17.6 tn | 1,491 tons/mi² |
Freelandville, Indiana CO2 Emissions
| 2013 CO2 emissions (tonnes/year) | 12,768 tn |
| 2013 CO2 emissions (tonnes/year) per capita | 20.3 tn |
| 2013 CO2 emissions intensity (tonnes/mi²/year) |
Natural Hazards Risk
Relative risk out of 10| Flood | High (9) |
| Earthquake | Medium (2.7) |
* Risk, particularly concerning flood or landslide, may not be for the entire area.
Sources: 1. Dilley, M., R.S. Chen, U. Deichmann, A.L. Lerner-Lam, M. Arnold, J. Agwe, P. Buys, O. Kjekstad, B. Lyon, and G. Yetman. 2005. Natural Disaster Hotspots: A Global Risk Analysis. Washington, D.C.: World Bank. https://doi.org/10.1596/0-8213-5930-4.
2. Center for Hazards and Risk Research - CHRR - Columbia University, Center for International Earth Science Information Network - CIESIN - Columbia University. 2005. Global Flood Hazard Frequency and Distribution. Palisades, NY: NASA Socioeconomic Data and Applications Center (SEDAC). https://doi.org/10.7927/H4668B3D.
3. Center for Hazards and Risk Research - CHRR - Columbia University, Center for International Earth Science Information Network - CIESIN - Columbia University. 2005. Global Earthquake Hazard Distribution - Peak Ground Acceleration. Palisades, NY: NASA Socioeconomic Data and Applications Center (SEDAC). https://doi.org/10.7927/H4BZ63ZS.
Recent Nearby Earthquakes
Magnitude 3.0 and greater| Date | Time | Magnitude | Distance | Depth | Location | Link |
|---|---|---|---|---|---|---|
| 9/19/17 | 4:47 AM | 3.8 | 71.8 km | 11,680 m | 13km W of Mount Carmel, Illinois | usgs.gov |
| 9/8/17 | 9:15 PM | 3.06 | 72 km | 11,760 m | 13km W of Mount Carmel, Illinois | usgs.gov |
| 11/20/12 | 3:28 PM | 3.6 | 69 km | 18,560 m | 13km WNW of Mount Carmel, Illinois | usgs.gov |
| 5/10/12 | 3:54 PM | 3.1 | 14.9 km | 10,700 m | 13km WNW of Bicknell, Indiana | usgs.gov |
| 7/17/08 | 7:58 PM | 3.1 | 69.5 km | 18,280 m | 12km WNW of Mount Carmel, Illinois | usgs.gov |
| 6/5/08 | 12:13 AM | 3.4 | 65.4 km | 16,239 m | 8km WNW of Mount Carmel, Illinois | usgs.gov |
| 4/30/08 | 10:30 PM | 3.3 | 66.4 km | 14,320 m | 9km WNW of Mount Carmel, Illinois | usgs.gov |
| 4/25/08 | 10:31 AM | 3.7 | 67.5 km | 12,980 m | 10km WNW of Mount Carmel, Illinois | usgs.gov |
| 4/20/08 | 10:38 PM | 4 | 67.9 km | 18,290 m | 10km WNW of Mount Carmel, Illinois | usgs.gov |
| 4/18/08 | 8:14 AM | 4.7 | 66.6 km | 15,460 m | 10km WNW of Mount Carmel, Illinois | usgs.gov |
Find historical earthquake occurrences near Freelandville, Indiana
Earliest Date Latest Date
Magnitude 3.0 and greater Magnitude 4.0 and greater Magnitude 5.0 and greater

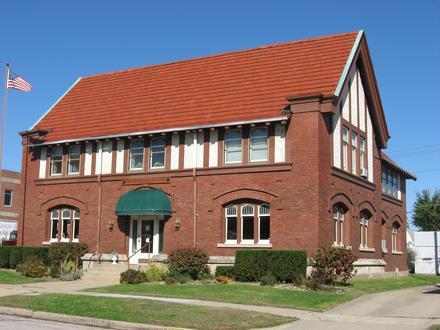
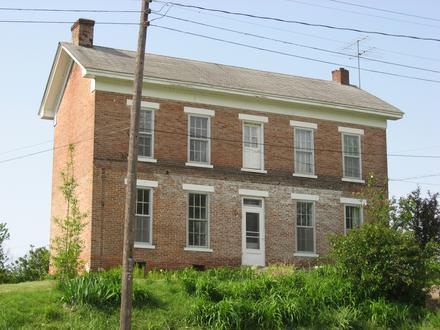
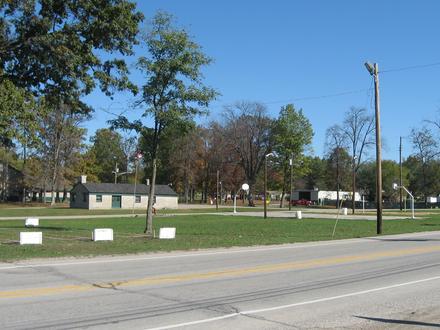
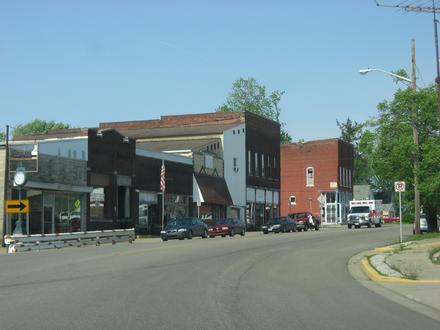
Freelandville, Indiana
Freelandville is an unincorporated census-designated place in Widner Township, Knox County, Indiana, United States. Freelandville is located around the intersection of State Roads 58 and 159. Freelandville, Indiana Wikipedia Page
About Our Data
The data on this page is estimated using a number of publicly available tools and resources. It is provided without warranty, and could contain inaccuracies. Use at your own risk. See here for more information.