Categories in Phoenix, Oregon
Industries
Business Distribution by Industry in Phoenix, Oregon
| Industry Description | Number of Establishments | Average Age of Business | Average Google Rating |
|---|---|---|---|
| Shopping | 57 | 39 years | 4 |
| Restaurants | 22 | 20 years | 4.2 |
| General contractors | 16 | 28 years | 3.8 |
| Real estate | 15 | 31 years | 3.9 |
| Education | 13 | 42 years | 4 |
| Clothing stores | 12 | 33 years | 3.1 |
| Pet grooming and boarding | 11 | 29 years | 4.6 |
| Car repair | 11 | 35 years | 4.2 |
| Shopping other | 10 | 40 years | 4.4 |
| Personal services | 10 | 45 years | 4.4 |
| Automotive | 9 | 47 years | 4.7 |
| Corporate management | 9 | 28 years | 3.8 |
| All food and beverage | 9 | 28 years | 4.1 |
| Grocery stores and supermarkets | 9 | 38 years | 3.9 |
| Construction of buildings | 8 | — | 3.8 |
| Churches | 8 | — | 4.8 |
| Health and medical | 7 | — | 3.4 |
| Loan companies | 7 | 31 years | 3.6 |
| Gas station | 7 | — | 4.1 |
| Religion | 7 | — | 4.8 |
| Other construction | 7 | 28 years | 4.2 |
| Physical education | 7 | — | 3.2 |
| Other accommodation | 6 | 39 years | 4 |
| Second hand stores | 6 | — | 4.5 |
| Gifts, cards and party supplies | 6 | 28 years | 4.1 |
Phoenix, Oregon Facts
| Area | 1.5 mi² |
| Population | 4,631 |
| Male Population | 2,201 (47.5%) |
| Female Population | 2,430 (52.5%) |
| Population change (1975 to 2020) | +64.1% |
| Population change (2000 to 2020) | +22.4% |
| Median Age | 42.4 years (Male: 40, Female: 45.3) |
| Area Codes | 541 |
| Neighborhoods | Phoenix, Northeast Portland, King |
| Local Time | |
| Timezone | Pacific Daylight Time |
| Lat & Lng | 42.27541, -122.81809 |
| Zip Codes | 97535 |
Map of Phoenix, Oregon
Interactive Map
Phoenix, Oregon Population
Years 1975 to 2020
| Data | 1975 | 1990 | 2000 | 2015 | 2020 |
|---|---|---|---|---|---|
| Population | 2,822 | 3,345 | 3,782 | 4,419 | 4,631 |
| Population Density | 1,917.1 / mi² | 2,272.4 / mi² | 2,569.3 / mi² | 3,002 / mi² | 3,146 / mi² |
Phoenix, Oregon Population change from 2000 to 2015
Increase of 16.8% from year 2000 to 2015
| Location | Change since 1975 | Change since 1990 | Change since 2000 |
|---|---|---|---|
| Phoenix, Oregon | +56.6% | +32.1% | +16.8% |
| Oregon | +65% | +34.6% | +16.8% |
| United States | +46.9% | +27.2% | +13.7% |
Phoenix, Oregon Median Age
Median Age: 42.4 years
| Location | Median Age | Median Age (Female) | Median Age (Male) |
|---|---|---|---|
| Phoenix, Oregon | 42.4 yrs | 45.3 yrs | 40 yrs |
| Oregon | 38.4 yrs | 39.6 yrs | 37.3 yrs |
| United States | 37.4 yrs | 38.7 yrs | 36.1 yrs |
Phoenix, Oregon Population Density
Population Density: 3,146 / mi²
| Location | Population | Area | Density |
|---|---|---|---|
| Phoenix, Oregon | 4,631 | 1.472 sq mi | 3,146 / mi² |
| Oregon | 4 million | 98,378.8 sq mi | 40.8 / mi² |
| United States | 321.6 million | 3,796,740.8 sq mi | 84.7 / mi² |
Phoenix, Oregon Historical and Projected Population
Estimated Population from 1870 to 2100
- JRC (European Commission's Joint Research Centre) work on the GHS built-up grid
- CIESIN (Center for International Earth Science Information Network)
- [Link] Klein Goldewijk, K., Beusen, A., Doelman, J., and Stehfest, E.: Anthropogenic land use estimates for the Holocene – HYDE 3.2, Earth Syst. Sci. Data, 9, 927–953, https://doi.org/10.5194/essd-9-927-2017, 2017.
Price Distribution
Business distribution by price for Phoenix, Oregon
Human Development Index (HDI)
Statistic composite index of life expectancy, education, and per capita income.
Phoenix, Oregon CO2 Emissions
Carbon Dioxide (CO2) Emissions Per Capita in Tonnes Per Year
| Location | CO2 Emissions | CO2 Emissions Per Capita | CO2 Emissions Intensity |
|---|---|---|---|
| Phoenix, Oregon | 71,113 tn | 15.36 tn | 48,310.2 tons/mi² |
| Oregon | 70,678,562 tn | 17.59 tn | 718.4 tons/mi² |
| United States | 5,664,619,810 tn | 17.62 tn | 1,492 tons/mi² |
| 2013 CO2 emissions (tonnes/year) | 71,113 tn |
| 2013 CO2 emissions (tonnes/year) per capita | 15.36 tn |
| 2013 CO2 emissions intensity (tonnes/mi²/year) | 48,310.2 tons/mi² |
Natural Hazards Risk
Relative risk out of 10
| Hazard | Risk Level |
|---|---|
| Drought | High (9) |
| Earthquake | Medium (4) |
* Risk, particularly concerning flood or landslide, may not be for the entire area.
- Dilley, M., R.S. Chen, U. Deichmann, A.L. Lerner-Lam, M. Arnold, J. Agwe, P. Buys, O. Kjekstad, B. Lyon, and G. Yetman. 2005. Natural Disaster Hotspots: A Global Risk Analysis. Washington, D.C.: World Bank. https://doi.org/10.1596/0-8213-5930-4.
- Center for Hazards and Risk Research - CHRR - Columbia University, Center for International Earth Science Information Network - CIESIN - Columbia University, and International Research Institute for Climate and Society - IRI - Columbia University. 2005. Global Drought Hazard Frequency and Distribution. Palisades, NY: NASA Socioeconomic Data and Applications Center (SEDAC). https://doi.org/10.7927/H4VX0DFT.
- Center for Hazards and Risk Research - CHRR - Columbia University, Center for International Earth Science Information Network - CIESIN - Columbia University. 2005. Global Earthquake Hazard Distribution - Peak Ground Acceleration. Palisades, NY: NASA Socioeconomic Data and Applications Center (SEDAC). https://doi.org/10.7927/H4BZ63ZS.
Recent Nearby Earthquakes
Magnitude 3.0 and greater
| Date▼ | Time↕ | Magnitude↕ | Distance↕ | Depth↕ | Location↕ | Link |
|---|---|---|---|---|---|---|
| 3/24/13 | 11:39 AM | 3.1 | 50.2 km | 14,394 m | 33km E of Shady Cove, Oregon | usgs.gov |
| 2/26/09 | 9:52 AM | 4.24 | 93.5 km | 36,796 m | Oregon | usgs.gov |
| 1/11/09 | 1:30 AM | 3.02 | 98.4 km | 37,190 m | Northern California | usgs.gov |
| 5/15/02 | 5:54 PM | 4.3 | 75.8 km | 6,309 m | Oregon | usgs.gov |
| 11/29/99 | 4:04 AM | 3.4 | 66.2 km | 5,237 m | Oregon | usgs.gov |
| 7/18/99 | 2:44 AM | 3.09 | 81.9 km | 15,247 m | Northern California | usgs.gov |
| 7/19/97 | 6:22 AM | 3.45 | 77.2 km | 43,325 m | Northern California | usgs.gov |
| 1/11/97 | 5:04 PM | 3.18 | 65.8 km | 12,383 m | Northern California | usgs.gov |
| 11/17/94 | 8:29 PM | 3.9 | 65.6 km | -1,725 m | Oregon | usgs.gov |
| 11/1/94 | 3:02 AM | 3 | 70.5 km | 5,335 m | Oregon | usgs.gov |
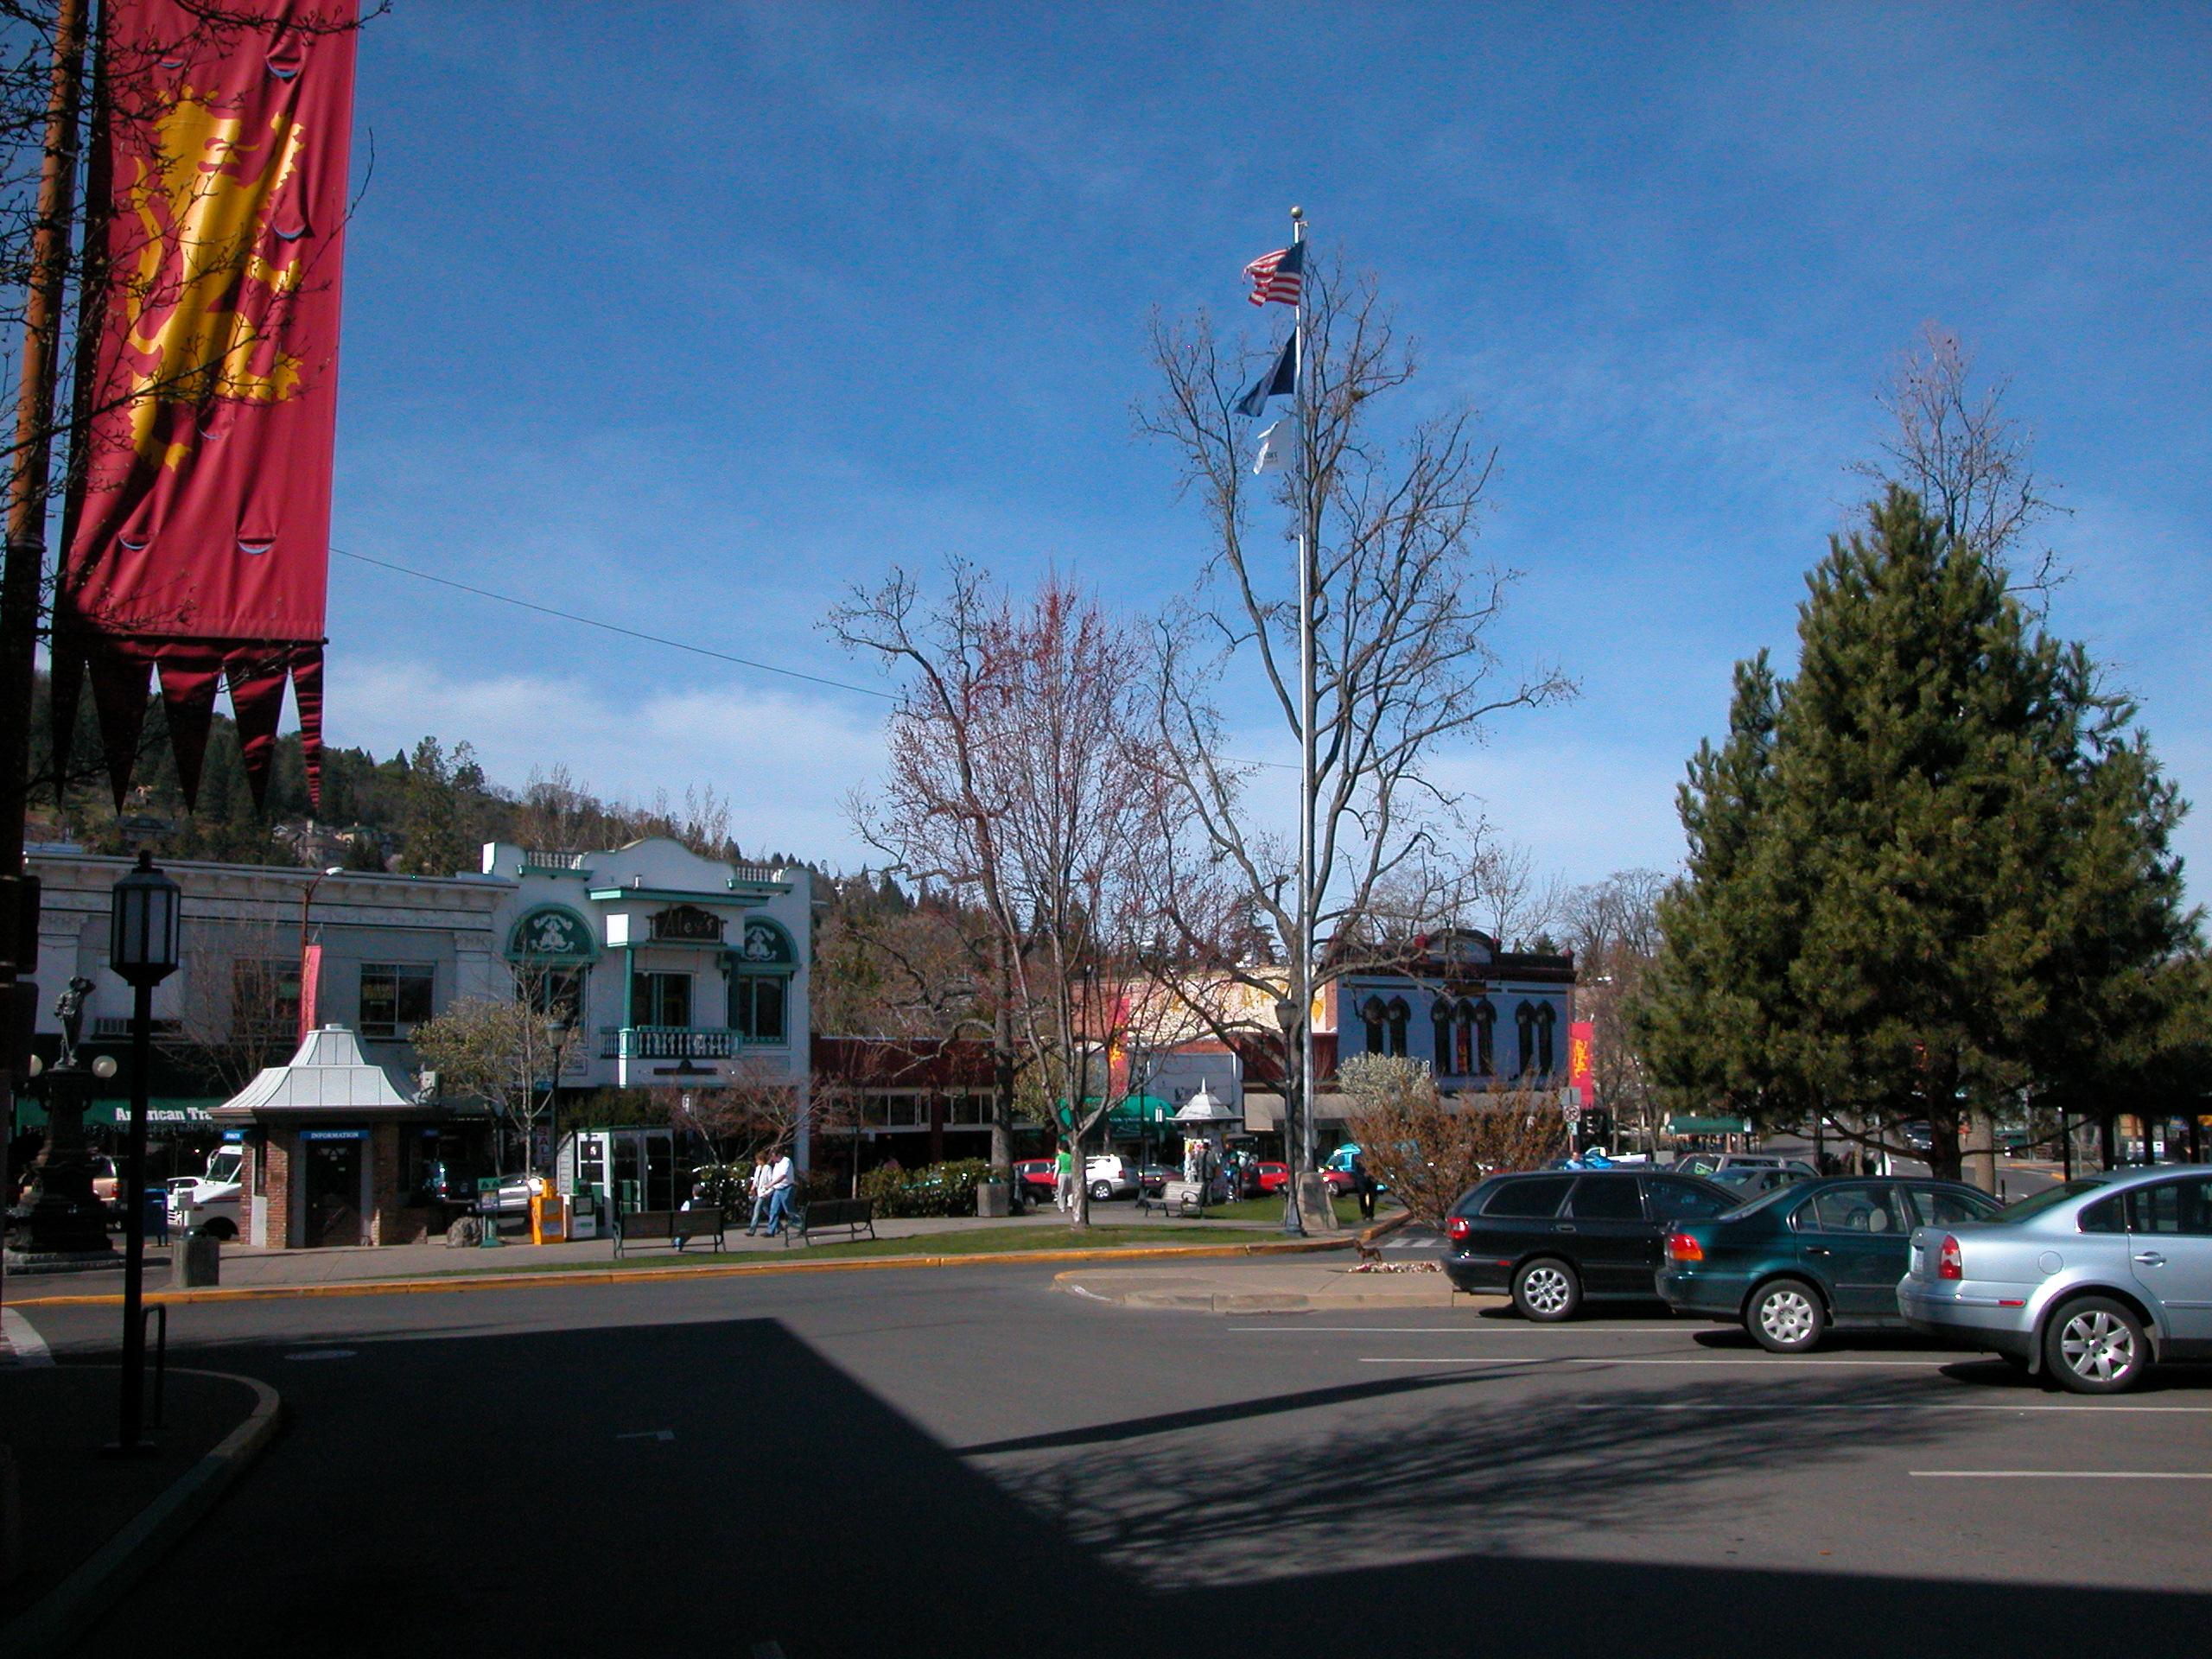
Phoenix, Oregon
Phoenix is a city in Jackson County, Oregon, United States. The population was 4,538 at the 2010 census. Phoenix is a part of the Medford Metropolitan Statistical Area, in the Rogue Valley, and is 3 miles (5 km) southwest of Medford on Interstate 5.
Phoenix, Oregon Wikipedia Page


About Our Data
The data on this page is estimated using a number of publicly available tools and resources. It is provided without warranty, and could contain inaccuracies. Use at your own risk.