Savin Hill Facts
| Area | 0.3 mi² |
| Population | 4,699 |
| Male Population | 2,348 (50.0%) |
| Female Population | 2,351 (50.0%) |
| Population change (1975 to 2020) | +49.5% |
| Population change (2000 to 2020) | +10.0% |
| Median Age | 33.4 years (Male: 33.4, Female: 33.3) |
| Neighborhoods | Dorchester, Uphams Corner - Jones Hill, Chinatown - Leather District |
| Local Time | |
| Timezone | Eastern Daylight Time |
| Lat & Lng | 42.31260, -71.05783 |
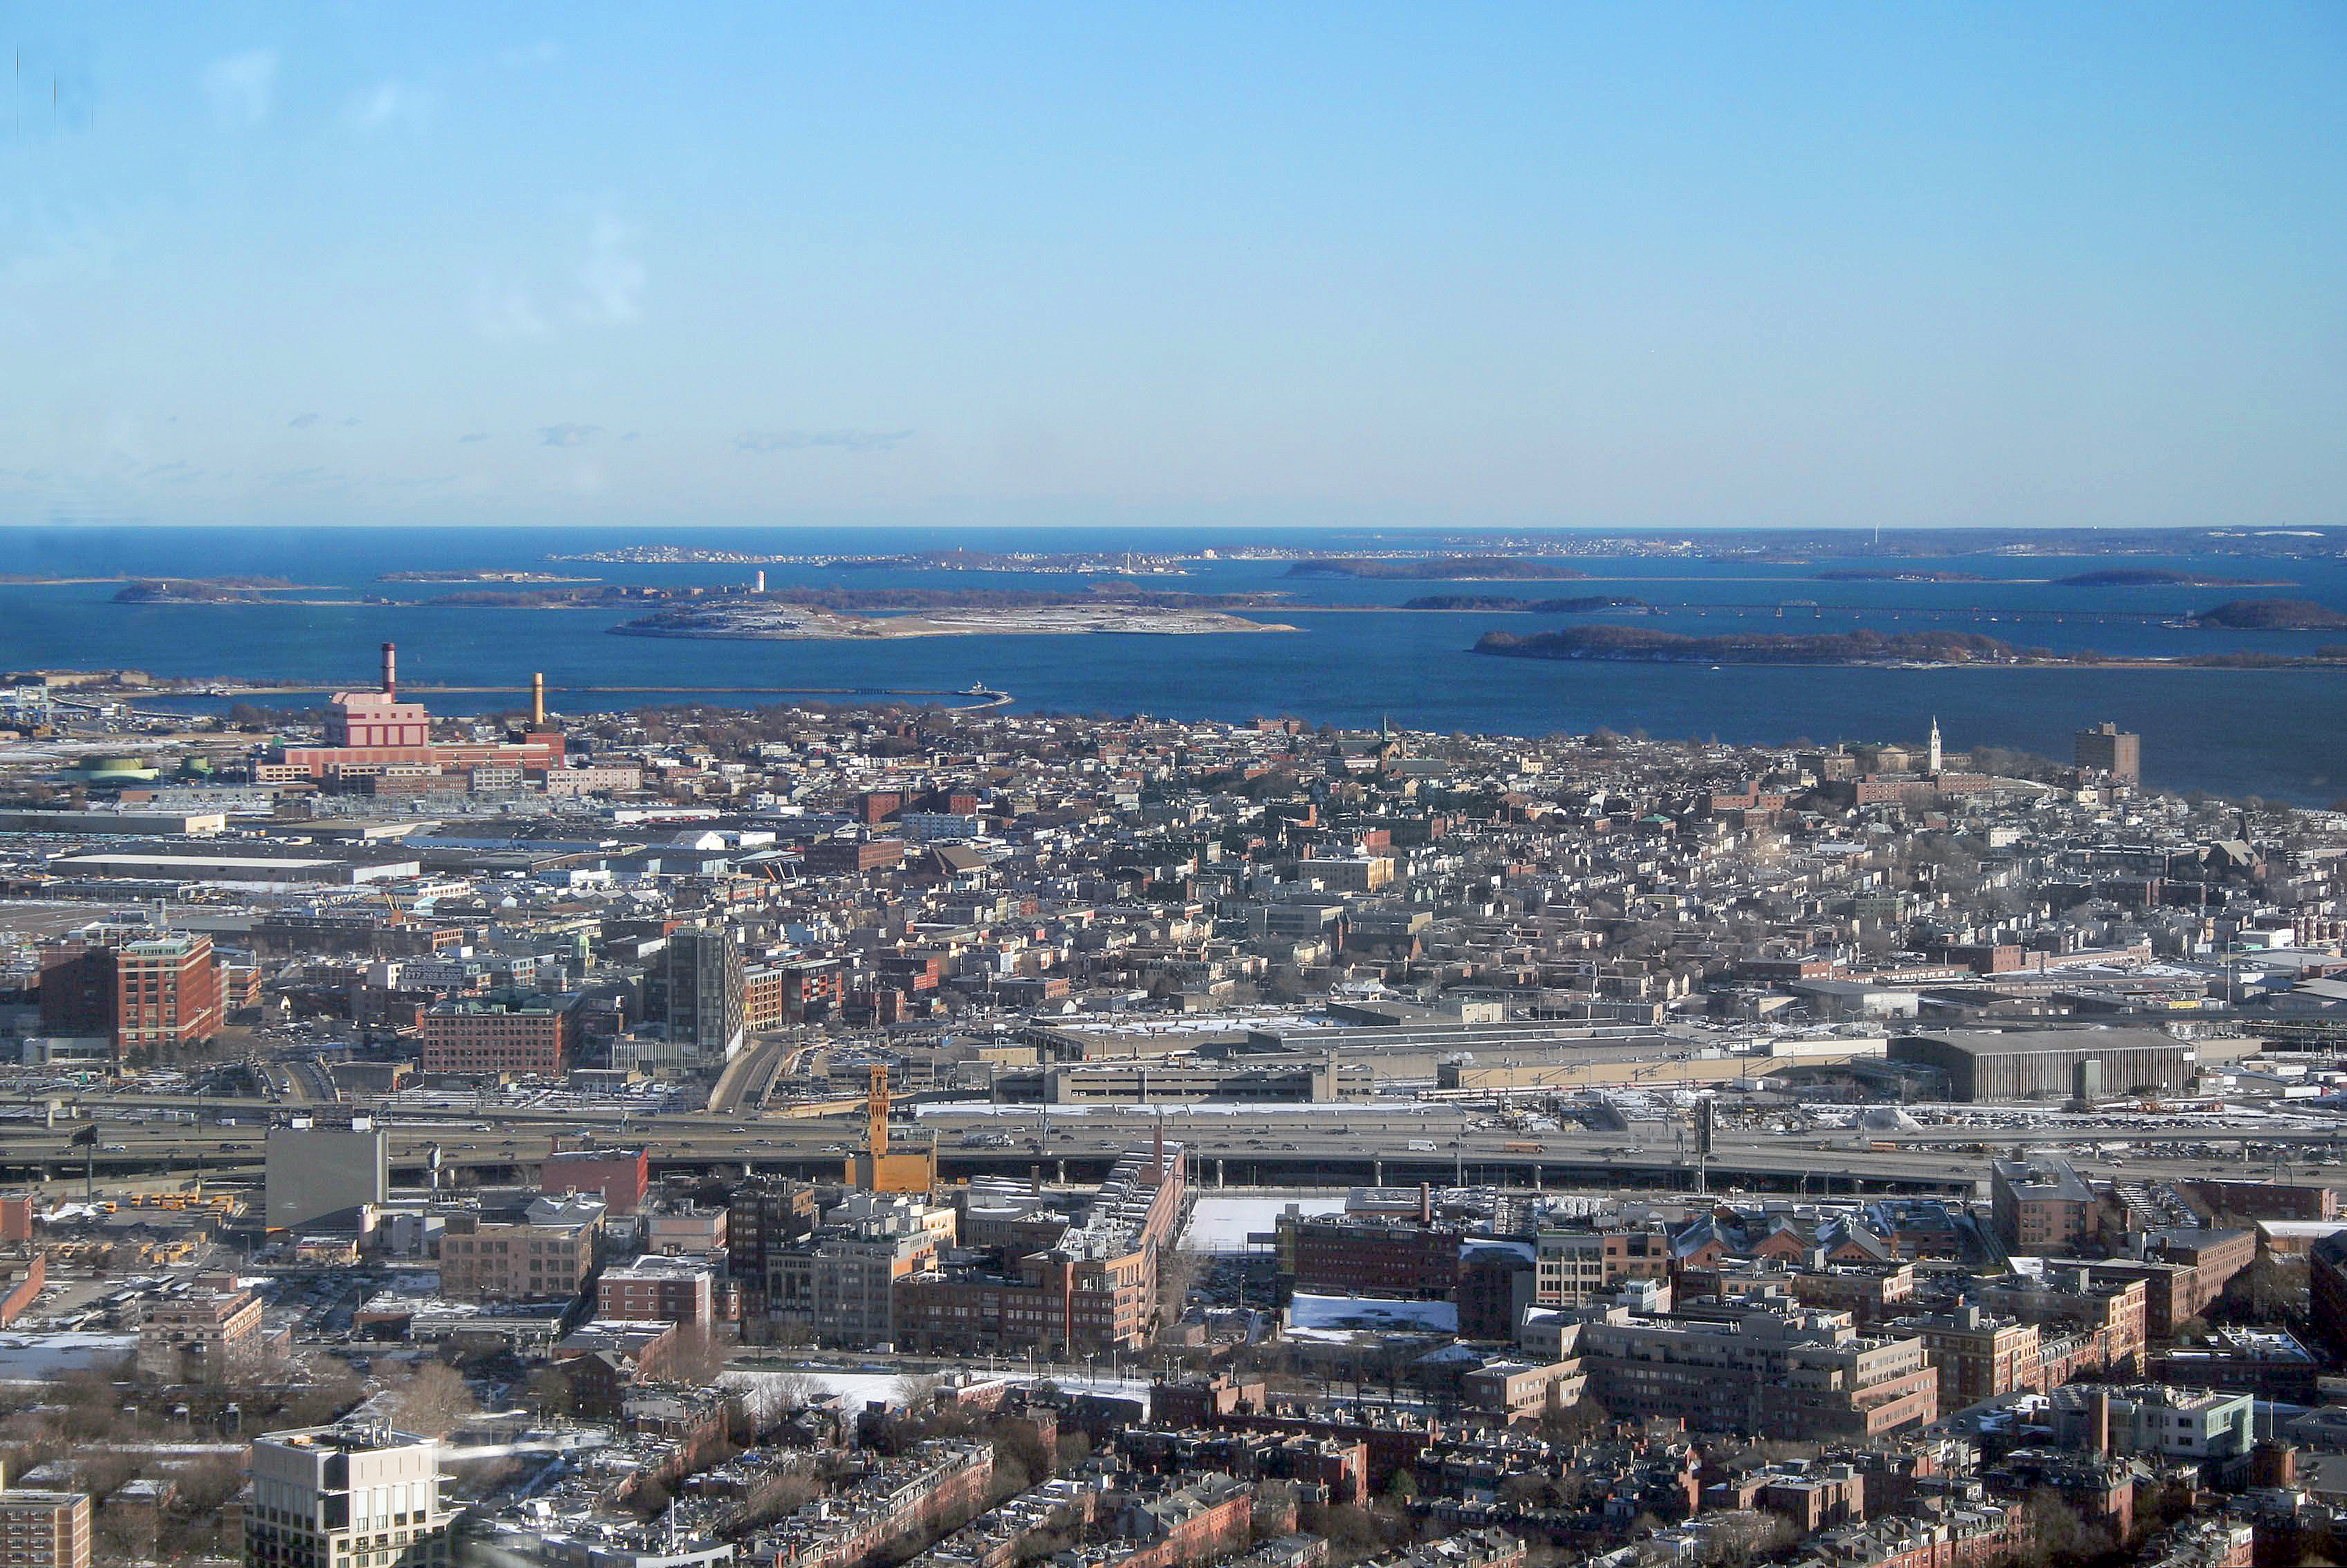
Map of Savin Hill
Interactive Map
Savin Hill Population
Years 1975 to 2020
| Data | 1975 | 1990 | 2000 | 2015 | 2020 |
|---|---|---|---|---|---|
| Population | 3,143 | 3,949 | 4,271 | 4,491 | 4,699 |
| Population Density | 10,853.8 / mi² | 13,637.2 / mi² | 14,749.1 / mi² | 15,508.9 / mi² | 16,227.1 / mi² |
Savin Hill Population change from 2000 to 2015
Increase of 5.2% from year 2000 to 2015
| Location | Change since 1975 | Change since 1990 | Change since 2000 |
|---|---|---|---|
| Savin Hill | +42.9% | +13.7% | +5.2% |
| Massachusetts | +20% | +9.8% | +3.1% |
| United States | +46.9% | +27.2% | +13.7% |
Savin Hill Median Age
Median Age: 33.4 years
| Location | Median Age | Median Age (Female) | Median Age (Male) |
|---|---|---|---|
| Savin Hill | 33.4 yrs | 33.3 yrs | 33.4 yrs |
| Massachusetts | 39.2 yrs | 40.6 yrs | 37.8 yrs |
| United States | 37.4 yrs | 38.7 yrs | 36.1 yrs |
Savin Hill Population Density
Population Density: 16,227 / mi²
| Location | Population | Area | Density |
|---|---|---|---|
| Savin Hill | 4,699 | 0.29 sq mi | 16,227 / mi² |
| Massachusetts | 6.6 million | 10,554.4 sq mi | 624 / mi² |
| United States | 321.6 million | 3,796,740.8 sq mi | 84.7 / mi² |
Savin Hill Historical and Projected Population
Estimated Population from 1810 to 2100
- JRC (European Commission's Joint Research Centre) work on the GHS built-up grid
- CIESIN (Center for International Earth Science Information Network)
- [Link] Klein Goldewijk, K., Beusen, A., Doelman, J., and Stehfest, E.: Anthropogenic land use estimates for the Holocene – HYDE 3.2, Earth Syst. Sci. Data, 9, 927–953, https://doi.org/10.5194/essd-9-927-2017, 2017.
Human Development Index (HDI)
Statistic composite index of life expectancy, education, and per capita income.
Savin Hill CO2 Emissions
Carbon Dioxide (CO2) Emissions Per Capita in Tonnes Per Year
| Location | CO2 Emissions | CO2 Emissions Per Capita | CO2 Emissions Intensity |
|---|---|---|---|
| Savin Hill | 55,784 tn | 11.87 tn | 192,639 tons/mi² |
| Massachusetts | 99,725,155 tn | 15.14 tn | 9,448.7 tons/mi² |
| United States | 5,664,619,810 tn | 17.62 tn | 1,492 tons/mi² |
| 2013 CO2 emissions (tonnes/year) | 55,784 tn |
| 2013 CO2 emissions (tonnes/year) per capita | 11.87 tn |
| 2013 CO2 emissions intensity (tonnes/mi²/year) | 192,639 tons/mi² |
Natural Hazards Risk
Relative risk out of 10
| Hazard | Risk Level |
|---|---|
| Flood | High (8) |
| Earthquake | Low (2) |
| Cyclone | High (8) |
* Risk, particularly concerning flood or landslide, may not be for the entire area.
- Dilley, M., R.S. Chen, U. Deichmann, A.L. Lerner-Lam, M. Arnold, J. Agwe, P. Buys, O. Kjekstad, B. Lyon, and G. Yetman. 2005. Natural Disaster Hotspots: A Global Risk Analysis. Washington, D.C.: World Bank. https://doi.org/10.1596/0-8213-5930-4.
- Center for Hazards and Risk Research - CHRR - Columbia University, Center for International Earth Science Information Network - CIESIN - Columbia University, International Bank for Reconstruction and Development - The World Bank, and United Nations Environment Programme Global Resource Information Database Geneva - UNEP/GRID-Geneva. 2005. Global Cyclone Hazard Frequency and Distribution. Palisades, NY: NASA Socioeconomic Data and Applications Center (SEDAC). https://doi.org/10.7927/H4CZ353K.
- Center for Hazards and Risk Research - CHRR - Columbia University, Center for International Earth Science Information Network - CIESIN - Columbia University. 2005. Global Flood Hazard Frequency and Distribution. Palisades, NY: NASA Socioeconomic Data and Applications Center (SEDAC). https://doi.org/10.7927/H4668B3D.
- Center for Hazards and Risk Research - CHRR - Columbia University, Center for International Earth Science Information Network - CIESIN - Columbia University. 2005. Global Earthquake Hazard Distribution - Peak Ground Acceleration. Palisades, NY: NASA Socioeconomic Data and Applications Center (SEDAC). https://doi.org/10.7927/H4BZ63ZS.
Recent Nearby Earthquakes
Magnitude 3.0 and greater
| Date▼ | Time↕ | Magnitude↕ | Distance↕ | Depth↕ | Location↕ | Link |
|---|---|---|---|---|---|---|
| 1/12/15 | 11:36 AM | 3.3 | 93.9 km | 5,400 m | 0km NE of Wauregan, Connecticut | usgs.gov |
| 1/27/00 | 2:49 PM | 3 | 77 km | 1,400 m | New Hampshire | usgs.gov |
| 1/10/99 | 3:20 PM | 3 | 58.8 km | 2,100 m | southern New England | usgs.gov |
| 1/10/99 | 10:52 AM | 3.1 | 58.9 km | 2,000 m | southern New England | usgs.gov |
| 3/22/96 | 8:22 PM | 3.1 | 70.8 km | 11,900 m | southern New England | usgs.gov |
| 10/2/94 | 2:36 PM | 3.3 | 95.8 km | 10,000 m | southern New England | usgs.gov |
| 8/24/89 | 3:56 PM | 3 | 78.7 km | 5,000 m | southern New England | usgs.gov |
| 10/15/85 | 8:00 PM | 3 | 41.7 km | 2,000 m | southern New England | usgs.gov |
| 1/27/82 | 6:50 PM | 3 | 49.7 km | 2,000 m | southern New England | usgs.gov |
| 12/20/77 | 5:44 PM | 3.1 | 60.3 km | 0 m | southern New England | usgs.gov |
Savin Hill
Savin Hill is a section of Dorchester, the largest neighborhood of Boston, Massachusetts, United States. after the geographic feature it covers and surrounds, Savin Hill is about one square mile in area, and has a population of about 15,000 people. ..
Savin Hill Wikipedia Page


About Our Data
The data on this page is estimated using a number of publicly available tools and resources. It is provided without warranty, and could contain inaccuracies. Use at your own risk.