Categories in Tracy, California
Industries
Business Distribution by Industry in Tracy, California
| Industry Description | Number of Establishments | Average Age of Business |
|---|---|---|
| Health and medical | 727 | 30 years |
| Real estate | 708 | 24 years |
| Restaurants | 450 | 29 years |
| Shopping | 349 | 28 years |
| Dentists | 326 | 26 years |
| Construction of buildings | 290 | 27 years |
| Corporate management | 279 | 22 years |
| Car repair | 277 | 25 years |
| Electronics stores | 178 | 28 years |
| Hairdressers | 171 | 24 years |
| Physicians and surgeons | 164 | 30 years |
| Shopping other | 163 | 31 years |
| Finance other | 160 | 67 years |
| Religion | 151 | 38 years |
Tracy, California Facts
| Area | 22.2 mi² |
| Population | 93,376 |
| Male Population | 46,323 (49.6%) |
| Female Population | 47,053 (50.4%) |
| Population change (1975 to 2020) | +75.0% |
| Population change (2000 to 2020) | +38.2% |
| Median Age | 32.4 years (Male: 31.2, Female: 33.5) |
| Area Codes | 209, 510, 805, 925 |
| Neighborhoods | Tracy, Edgewood, Wicklund Village, Glenbriar Estates, Muirfield |
| Local Time | |
| Timezone | Pacific Daylight Time |
| Lat & Lng | 37.73987, -121.42618 |
| Zip Codes | 95304, 95376, 95377, 95378, 95391 |
Map of Tracy, California
Interactive Map
Tracy, California Population
Years 1975 to 2020
| Data | 1975 | 1990 | 2000 | 2015 | 2020 |
|---|---|---|---|---|---|
| Population | 53,370 | 61,376 | 67,567 | 89,192 | 93,376 |
| Population Density | 2,409.2 / mi² | 2,770.6 / mi² | 3,050.1 / mi² | 4,026.3 / mi² | 4,215.1 / mi² |
Tracy, California Population change from 2000 to 2015
Increase of 32% from year 2000 to 2015
| Location | Change since 1975 | Change since 1990 | Change since 2000 |
|---|---|---|---|
| Tracy, California | +67.1% | +45.3% | +32% |
| California | +51.8% | +28.5% | +13.9% |
| United States | +46.9% | +27.2% | +13.7% |
Tracy, California Median Age
Median Age: 32.4 years
| Location | Median Age | Median Age (Female) | Median Age (Male) |
|---|---|---|---|
| Tracy, California | 32.4 yrs | 33.5 yrs | 31.2 yrs |
| California | 35.3 yrs | 36.5 yrs | 34.2 yrs |
| United States | 37.4 yrs | 38.7 yrs | 36.1 yrs |
Tracy, California Population Density
Population Density: 4,215 / mi²
| Location | Population | Area | Density |
|---|---|---|---|
| Tracy, California | 93,376 | 22.15 sq mi | 4,215 / mi² |
| California | 38.8 million | 163,694.5 sq mi | 237 / mi² |
| United States | 321.6 million | 3,796,740.8 sq mi | 84.7 / mi² |
Tracy, California Historical and Projected Population
Estimated Population from 1880 to 2100
- JRC (European Commission's Joint Research Centre) work on the GHS built-up grid
- CIESIN (Center for International Earth Science Information Network)
- [Link] Klein Goldewijk, K., Beusen, A., Doelman, J., and Stehfest, E.: Anthropogenic land use estimates for the Holocene – HYDE 3.2, Earth Syst. Sci. Data, 9, 927–953, https://doi.org/10.5194/essd-9-927-2017, 2017.
Neighborhoods in Tracy, California
Percentage of businesses by neighborhood in Tracy, California
Zip Codes
Percentage of businesses by Postal Codes in Tracy, California
Price Distribution
Business distribution by price for Tracy, California
Human Development Index (HDI)
Statistic composite index of life expectancy, education, and per capita income.
Tracy, California CO2 Emissions
Carbon Dioxide (CO2) Emissions Per Capita in Tonnes Per Year
| Location | CO2 Emissions | CO2 Emissions Per Capita | CO2 Emissions Intensity |
|---|---|---|---|
| Tracy, California | 1,597,139 tn | 17.1 tn | 72,097.1 tons/mi² |
| California | 625,399,868 tn | 16.13 tn | 3,820.5 tons/mi² |
| United States | 5,664,619,810 tn | 17.62 tn | 1,492 tons/mi² |
| 2013 CO2 emissions (tonnes/year) | 1,597,139 tn |
| 2013 CO2 emissions (tonnes/year) per capita | 17.1 tn |
| 2013 CO2 emissions intensity (tonnes/mi²/year) | 72,097.1 tons/mi² |
Natural Hazards Risk
Relative risk out of 10
| Hazard | Risk Level |
|---|---|
| Drought | High (9) |
| Flood | Medium (4) |
| Earthquake | High (8.4) |
* Risk, particularly concerning flood or landslide, may not be for the entire area.
- Dilley, M., R.S. Chen, U. Deichmann, A.L. Lerner-Lam, M. Arnold, J. Agwe, P. Buys, O. Kjekstad, B. Lyon, and G. Yetman. 2005. Natural Disaster Hotspots: A Global Risk Analysis. Washington, D.C.: World Bank. https://doi.org/10.1596/0-8213-5930-4.
- Center for Hazards and Risk Research - CHRR - Columbia University, Center for International Earth Science Information Network - CIESIN - Columbia University, and International Research Institute for Climate and Society - IRI - Columbia University. 2005. Global Drought Hazard Frequency and Distribution. Palisades, NY: NASA Socioeconomic Data and Applications Center (SEDAC). https://doi.org/10.7927/H4VX0DFT.
- Center for Hazards and Risk Research - CHRR - Columbia University, Center for International Earth Science Information Network - CIESIN - Columbia University. 2005. Global Flood Hazard Frequency and Distribution. Palisades, NY: NASA Socioeconomic Data and Applications Center (SEDAC). https://doi.org/10.7927/H4668B3D.
- Center for Hazards and Risk Research - CHRR - Columbia University, Center for International Earth Science Information Network - CIESIN - Columbia University. 2005. Global Earthquake Hazard Distribution - Peak Ground Acceleration. Palisades, NY: NASA Socioeconomic Data and Applications Center (SEDAC). https://doi.org/10.7927/H4BZ63ZS.
Recent Nearby Earthquakes
Magnitude 3.0 and greater
| Date▼ | Time↕ | Magnitude↕ | Distance↕ | Depth↕ | Location↕ | Link |
|---|---|---|---|---|---|---|
| 7/16/19 | 8:24 PM | 3.2 | 30.7 km | 11,710 m | 12km WSW of Byron, CA | usgs.gov |
| 7/16/19 | 8:11 PM | 4.31 | 30.4 km | 12,380 m | 12km WSW of Byron, CA | usgs.gov |
| 10/15/10 | 11:04 AM | 3.13 | 15.9 km | 14,552 m | Northern California | usgs.gov |
| 10/5/10 | 1:28 PM | 3.07 | 38.6 km | 7,390 m | Northern California | usgs.gov |
| 1/25/06 | 3:29 PM | 3.6 | 39.6 km | 5,149 m | Northern California | usgs.gov |
| 2/5/05 | 6:43 PM | 4.18 | 38 km | 7,195 m | Northern California | usgs.gov |
| 9/29/02 | 7:41 AM | 3.42 | 22.1 km | 4,312 m | Northern California | usgs.gov |
| 8/8/98 | 9:38 AM | 3.02 | 33.7 km | 8,340 m | Northern California | usgs.gov |
| 7/6/98 | 2:59 AM | 3.07 | 27.8 km | 14,125 m | Northern California | usgs.gov |
| 7/30/97 | 11:30 AM | 3.16 | 28.3 km | 7,245 m | Northern California | usgs.gov |
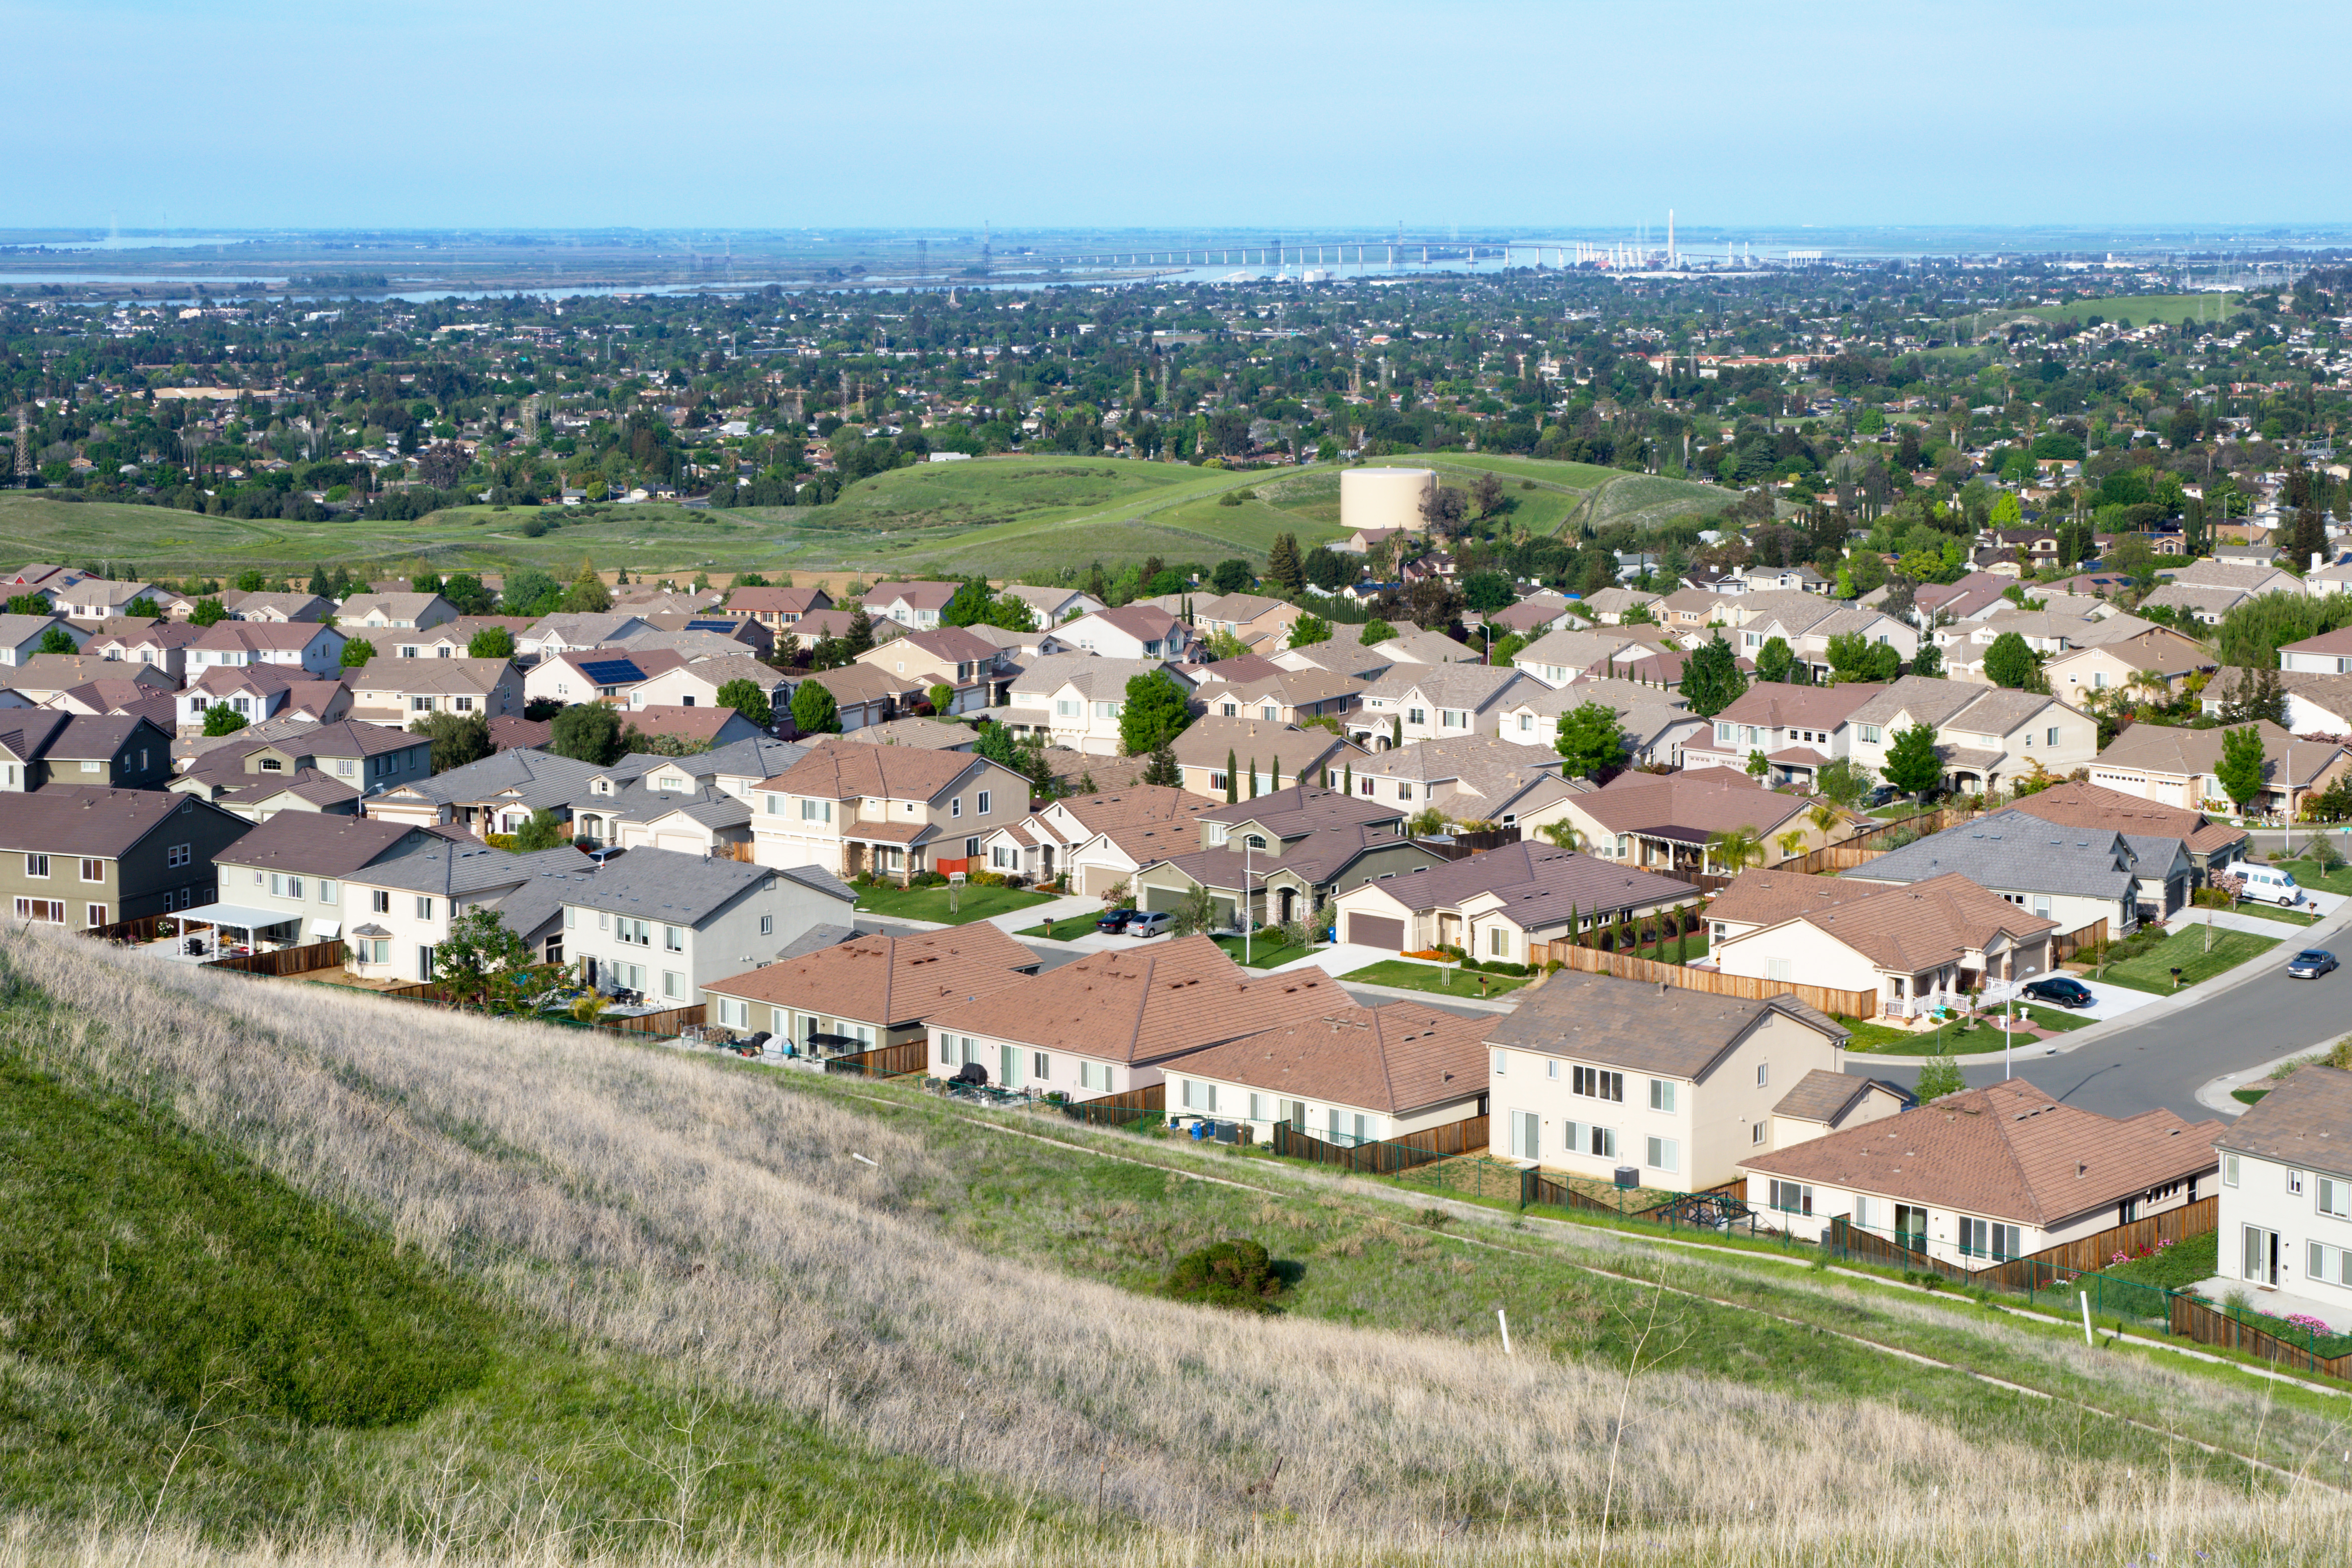
Tracy, California
Tracy is the second most populated city in San Joaquin County, California, United States. The population was 82,922 at the 2010 census. Tracy is located inside a geographic triangle formed by Interstate 205 on the north side of the city, Interstate 5..
Tracy, California Wikipedia Page


About Our Data
The data on this page is estimated using a number of publicly available tools and resources. It is provided without warranty, and could contain inaccuracies. Use at your own risk.