Businesses in Valley Center, California
Hotels & Travel
Restaurants
Automotive
Financial Services
Medical
Beauty & Spas
Community & Government
Industries
Business Distribution by Industry Shopping: 16.2%
Industry: 16.1%
Home Services: 13.2%
Professional Services: 13.1%
Medical: 5.3%
Other: 36.1%
| Industry Description | Number of Establishments | Average Age of Business | Average Google Rating | Businesses per 1,000 residents |
|---|---|---|---|---|
| Car parts | 14 | 37.5 years | 4.0 | 1.4 |
| Car repair | 35 | 34.3 years | 3.8 | 3.6 |
| Primary and elementary schools | 11 | 42.5 years | 4.2 | 1.1 |
| Loan companies | 16 | 38.2 years | 4.1 | 1.7 |
| Fruits and vegetables | 17 | 33.6 years | 4.1 | 1.8 |
| Grocery stores and supermarkets | 47 | 29.7 years | 4.4 | 4.9 |
| Electrical installation | 16 | 28.5 years | 4.0 | 1.7 |
| General contractors | 89 | 29.4 years | 4.3 | 9.2 |
| Landscaping | 18 | 27.2 years | 4.4 | 1.9 |
| Other construction | 50 | 29.8 years | 4.6 | 5.2 |
| Real estate | 36 | 29.3 years | 4.0 | 3.7 |
| Construction of buildings | 44 | 31.2 years | 4.4 | 4.6 |
| Farming | 16 | 31.6 years | 4.5 | 1.7 |
| Other membership organizations | 14 | 58.7 years | 4.6 | 1.4 |
| Tractors and farm equipment | 12 | 34.6 years | 4.7 | 1.2 |
| Wholesale of construction supplies | 11 | 30 years | 4.6 | 1.1 |
| Wholesale of machinery | 13 | 31.2 years | 4.4 | 1.3 |
| Personal services | 11 | 26.2 years | 4.6 | 1.1 |
| Dentists | 18 | 27.2 years | 4.8 | 1.9 |
| Health and medical | 52 | 29.8 years | 4.6 | 5.4 |
| Physicians and surgeons | 16 | 4.3 | 1.7 | |
| Animal and pet stores | 14 | 26.4 years | 4.9 | 1.4 |
| Pet grooming and boarding | 21 | 26.1 years | 4.8 | 2.2 |
| Veterinarians and animal clinics | 15 | 27.4 years | 4.9 | 1.6 |
| Accountants | 15 | 31 years | 3.7 | 1.6 |
| Architects | 11 | 25.2 years | 1.7 | 1.1 |
| Corporate management | 31 | 24.1 years | 3.6 | 3.2 |
| Scientific and technical services | 35 | 24.7 years | 3.1 | 3.6 |
| Specialized design | 21 | 19.7 years | 3.6 | 2.2 |
| Technical construction services | 20 | 35.2 years | 3.5 | 2.1 |
| Churches | 15 | 34.1 years | 4.5 | 1.6 |
| Electronics stores | 14 | 21.6 years | 2.8 | 1.4 |
| Hardware stores | 14 | 27.4 years | 4.9 | 1.4 |
| Household appliances and goods | 19 | 29.3 years | 4.4 | 2.0 |
| Nurseries and garden supplies | 17 | 28 years | 4.5 | 1.8 |
| Shopping other | 24 | 31 years | 4.5 | 2.5 |
| Area of Valley Center, California | 27.43 sq mi |
| Population | 9,661 |
| Male Population | 4,836 (50.1%) |
| Female Population | 4,825 (49.9%) |
| Population change from 1975 to 2015 | +37.4% |
| Population change from 2000 to 2015 | +13.8% |
| Median Age | 41.9 |
| Male Median Age | 41.9 |
| Female Median Age | 42 |
| Area Codes | 619, 760, 858 |
| Neighborhoods | Lake Wohlford, Valley Center |
| Local Time | Tuesday 5:29 AM |
| Timezone | Pacific Daylight Time |
| Lat & Lng | 33.21837° / -117.0342° |
| Zip Codes | 92082 |
Valley Center, California - Map
Valley Center, California Population
Years 1975 to 2015| Data | 1975 | 1990 | 2000 | 2015 |
|---|---|---|---|---|
| Population | 7,029 | 7,431 | 8,493 | 9,661 |
| Population Density | 256.3 / mi² | 270.9 / mi² | 309.7 / mi² | 352.3 / mi² |
Valley Center, California Population change from 2000 to 2015
Increase of 13.8% from year 2000 to 2015| Location | Change since 1975 | Change since 1990 | Change since 2000 |
|---|---|---|---|
| Valley Center, California | +37.4% | +30% | +13.8% |
| California | +51.8% | +28.5% | +13.9% |
| United States | +46.9% | +27.2% | +13.7% |
Valley Center, California Median Age
Median Age: 41.9 years| Location | Median Age | Median Age (Female) | Median Age (Male) |
|---|---|---|---|
| Valley Center, California | 41.9 years | 42 years | 41.9 years |
| California | 35.4 years | 36.5 years | 34.2 years |
| United States | 37.4 years | 38.7 years | 36.1 years |
Valley Center, California Population Tree
Population By Age and Gender| Age | Male | Female | Total |
|---|---|---|---|
| Under 5 | 262 | 285 | 548 |
| 5-9 | 311 | 280 | 591 |
| 10-14 | 350 | 354 | 705 |
| 15-19 | 403 | 389 | 793 |
| 20-24 | 289 | 264 | 553 |
| 25-29 | 217 | 229 | 446 |
| 30-34 | 224 | 195 | 419 |
| 35-39 | 244 | 279 | 523 |
| 40-44 | 310 | 341 | 651 |
| 45-49 | 392 | 429 | 821 |
| 50-54 | 472 | 428 | 901 |
| 55-59 | 382 | 414 | 796 |
| 60-64 | 357 | 342 | 700 |
| 65-69 | 240 | 216 | 457 |
| 70-74 | 158 | 140 | 299 |
| 75-79 | 103 | 97 | 200 |
| 80-84 | 68 | 73 | 141 |
| 85 Plus | 54 | 72 | 126 |
Valley Center, California Population Density
Population Density: 352.3 / mi²| Location | Population | Area | Population Density |
|---|---|---|---|
| Valley Center, California | 9,661 | 27.43 sq mi | 352.3 / mi² |
| California | 38.8 million | 163,695.4 sq mi | 236.9 / mi² |
| United States | 321.6 million | 3,796,761.2 sq mi | 84.7 / mi² |
Valley Center, California Historical and Projected Population
Estimated Population from 1860 to 2100Sources:
1. JRC (European Commission's Joint Research Centre) work on the GHS built-up grid
2. CIESIN (Center for International Earth Science Information Network)
3. [Link] Klein Goldewijk, K., Beusen, A., Doelman, J., and Stehfest, E.: Anthropogenic land use estimates for the Holocene – HYDE 3.2, Earth Syst. Sci. Data, 9, 927–953, https://doi.org/10.5194/essd-9-927-2017, 2017.
Business distribution by price for Valley Center, California
Moderate: 55.2%
Inexpensive: 27.6%
Expensive: 14.9%
Very Expensive: 2.3%
Human Development Index (HDI)
Statistic composite index of life expectancy, education, and per capita income.Sources: [Link] Kummu, M., Taka, M. & Guillaume, J. Gridded global datasets for Gross Domestic Product and Human Development Index over 1990–2015. Sci Data 5, 180004 (2018) doi:10.1038/sdata.2018.4
Valley Center, California CO2 Emissions
Carbon Dioxide (CO2) Emissions Per Capita in Tonnes Per Year| Location | CO2 Emissions | CO2 Emissions Per Capita | CO2 Emissions Intensity |
|---|---|---|---|
| Valley Center, California | 149,350 tn | 15.5 tn | 5,445 tons/mi² |
| California | 625,399,867 tn | 16.1 tn | 3,820 tons/mi² |
| United States | 5,664,619,809 tn | 17.6 tn | 1,491 tons/mi² |
Valley Center, California CO2 Emissions
| 2013 CO2 emissions (tonnes/year) | 149,350 tn |
| 2013 CO2 emissions (tonnes/year) per capita | 15.5 tn |
| 2013 CO2 emissions intensity (tonnes/mi²/year) |
Natural Hazards Risk
Relative risk out of 10| Drought | High (9) |
| Flood | Medium (4) |
| Earthquake | High (9) |
* Risk, particularly concerning flood or landslide, may not be for the entire area.
Sources: 1. Dilley, M., R.S. Chen, U. Deichmann, A.L. Lerner-Lam, M. Arnold, J. Agwe, P. Buys, O. Kjekstad, B. Lyon, and G. Yetman. 2005. Natural Disaster Hotspots: A Global Risk Analysis. Washington, D.C.: World Bank. https://doi.org/10.1596/0-8213-5930-4.
2. Center for Hazards and Risk Research - CHRR - Columbia University, Center for International Earth Science Information Network - CIESIN - Columbia University, and International Research Institute for Climate and Society - IRI - Columbia University. 2005. Global Drought Hazard Frequency and Distribution. Palisades, NY: NASA Socioeconomic Data and Applications Center (SEDAC). https://doi.org/10.7927/H4VX0DFT.
3. Center for Hazards and Risk Research - CHRR - Columbia University, Center for International Earth Science Information Network - CIESIN - Columbia University. 2005. Global Earthquake Hazard Distribution - Peak Ground Acceleration. Palisades, NY: NASA Socioeconomic Data and Applications Center (SEDAC). https://doi.org/10.7927/H4BZ63ZS.
4. Center for Hazards and Risk Research - CHRR - Columbia University, Center for International Earth Science Information Network - CIESIN - Columbia University. 2005. Global Flood Hazard Frequency and Distribution. Palisades, NY: NASA Socioeconomic Data and Applications Center (SEDAC). https://doi.org/10.7927/H4668B3D.
Recent Nearby Earthquakes
Magnitude 3.0 and greater| Date | Time | Magnitude | Distance | Depth | Location | Link |
|---|---|---|---|---|---|---|
| 10/15/15 | 10:29 PM | 3.19 | 23.5 km | 8,530 m | 4km NW of Lake Henshaw, CA | usgs.gov |
| 8/22/13 | 6:29 AM | 3.59 | 24.3 km | 6,748 m | 8km N of Pala, CA | usgs.gov |
| 3/29/12 | 11:09 PM | 3.26 | 17.3 km | 13,889 m | 6km SSW of Palomar Observatory, CA | usgs.gov |
| 3/29/11 | 3:43 AM | 3.7 | 25.9 km | 10,018 m | 2km SSE of Lake Henshaw, CA | usgs.gov |
| 1/10/11 | 3:26 AM | 3.11 | 24.4 km | 9,868 m | 2km SSW of Lake Henshaw, CA | usgs.gov |
| 3/13/05 | 3:43 PM | 3.45 | 19.4 km | 12,459 m | 6km S of Palomar Observatory, CA | usgs.gov |
| 4/5/04 | 1:38 PM | 3.42 | 23.5 km | 9,976 m | 10km WSW of Aguanga, CA | usgs.gov |
| 6/3/98 | 11:07 PM | 3.7 | 29.8 km | 11,449 m | 1km E of Aguanga, California | usgs.gov |
| 5/28/97 | 5:48 PM | 3.35 | 18.3 km | 6,061 m | 5km WSW of Palomar Observatory, California | usgs.gov |
| 4/6/97 | 4:41 AM | 3.14 | 23.9 km | 10,801 m | 8km WSW of Aguanga, California | usgs.gov |
Find historical earthquake occurrences near Valley Center, California
Earliest Date Latest Date
Magnitude 3.0 and greater Magnitude 4.0 and greater Magnitude 5.0 and greater

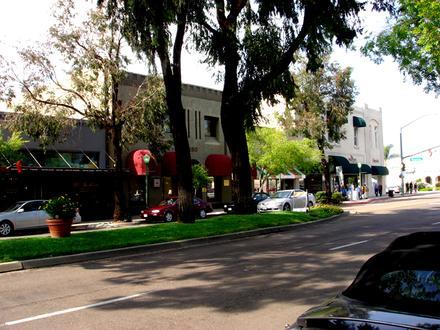
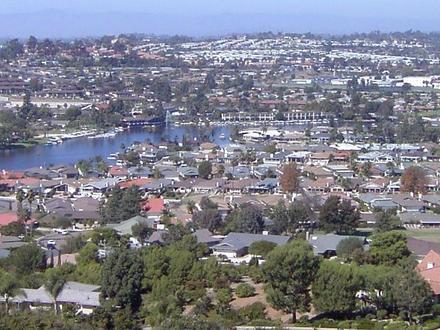
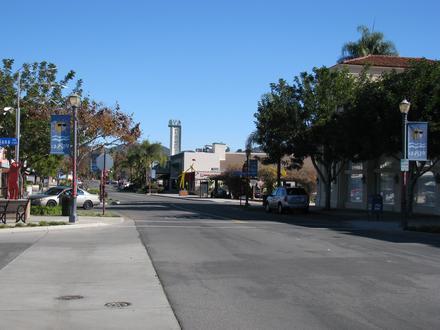
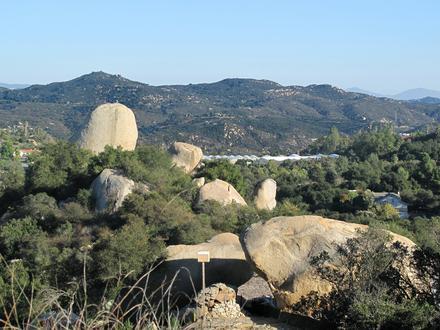
Valley Center, California
Valley Center is a census-designated place (CDP) in North San Diego County, California. The population was 3,277 at the 2010 census, up from 1,865 at the 2000 census. Valley Center, California Wikipedia Page
About Our Data
The data on this page is estimated using a number of publicly available tools and resources. It is provided without warranty, and could contain inaccuracies. Use at your own risk. See here for more information.