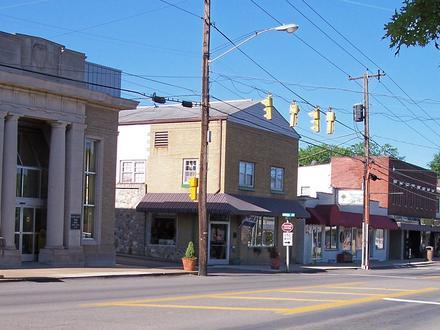
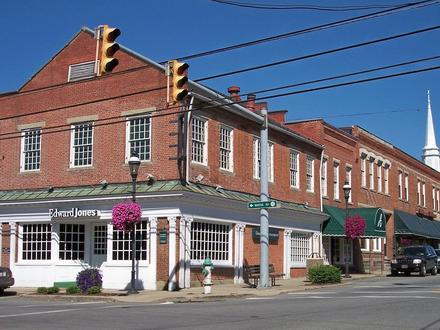
Businesses in West Hamlin, West Virginia
Industries
Business Distribution by Industry Religion: 15.4%
Industry: 12.5%
Financial Services: 10.6%
Automotive: 9.6%
Shopping: 7.7%
Home Services: 7.7%
Local Services: 6.7%
Professional Services: 6.7%
Medical: 4.8%
Beauty & Spas: 4.8%
Community & Government: 4.8%
Other: 8.7%
| Area of West Hamlin, West Virginia | 0.548 sq mi |
| Population | 642 |
| Male Population | 272 (42.4%) |
| Female Population | 370 (57.6%) |
| Population change from 1975 to 2015 | +1.6% |
| Population change from 2000 to 2015 | -4.5% |
| Median Age | 37.4 |
| Male Median Age | 37.2 |
| Female Median Age | 37.5 |
| Area Codes | 304 |
| Local Time | Tuesday 8:29 AM |
| Timezone | Eastern Daylight Time |
| Lat & Lng | 38.28564° / -82.1957° |
| Zip Codes | 25571 |
West Hamlin, West Virginia - Map
West Hamlin, West Virginia Population
Years 1975 to 2015| Data | 1975 | 1990 | 2000 | 2015 |
|---|---|---|---|---|
| Population | 632 | 655 | 672 | 642 |
| Population Density | 1,152 / mi² | 1,194 / mi² | 1,225 / mi² | 1,170 / mi² |
West Hamlin, West Virginia Population change from 2000 to 2015
Decrease of 4.5% from year 2000 to 2015| Location | Change since 1975 | Change since 1990 | Change since 2000 |
|---|---|---|---|
| West Hamlin, West Virginia | +1.6% | -2% | -4.5% |
| West Virginia | +13.3% | +7.5% | +2.5% |
| United States | +46.9% | +27.2% | +13.7% |
West Hamlin, West Virginia Median Age
Median Age: 37.4 years| Location | Median Age | Median Age (Female) | Median Age (Male) |
|---|---|---|---|
| West Hamlin, West Virginia | 37.4 years | 37.5 years | 37.2 years |
| West Virginia | 41.4 years | 42.7 years | 40 years |
| United States | 37.4 years | 38.7 years | 36.1 years |
West Hamlin, West Virginia Population Tree
Population By Age and Gender| Age | Male | Female | Total |
|---|---|---|---|
| Under 5 | 14 | 34 | 49 |
| 5-9 | 22 | 15 | 38 |
| 10-14 | 10 | 27 | 38 |
| 15-19 | 25 | 33 | 58 |
| 20-24 | 17 | 20 | 37 |
| 25-29 | 24 | 25 | 49 |
| 30-34 | 17 | 16 | 33 |
| 35-39 | 15 | 30 | 45 |
| 40-44 | 13 | 18 | 32 |
| 45-49 | 19 | 16 | 35 |
| 50-54 | 19 | 23 | 42 |
| 55-59 | 21 | 19 | 40 |
| 60-64 | 13 | 34 | 48 |
| 65-69 | 16 | 24 | 40 |
| 70-74 | 8 | 14 | 23 |
| 75-79 | 13 | 8 | 22 |
| 80-84 | 3 | 5 | 8 |
| 85 Plus | 3 | 9 | 13 |
West Hamlin, West Virginia Population Density
Population Density: 1,170 / mi²| Location | Population | Area | Population Density |
|---|---|---|---|
| West Hamlin, West Virginia | 642 | 0.548 sq mi | 1,170 / mi² |
| West Virginia | 1.9 million | 24,230.1 sq mi | 77.2 / mi² |
| United States | 321.6 million | 3,796,761.2 sq mi | 84.7 / mi² |
Human Development Index (HDI)
Statistic composite index of life expectancy, education, and per capita income.Sources: [Link] Kummu, M., Taka, M. & Guillaume, J. Gridded global datasets for Gross Domestic Product and Human Development Index over 1990–2015. Sci Data 5, 180004 (2018) doi:10.1038/sdata.2018.4
West Hamlin, West Virginia CO2 Emissions
Carbon Dioxide (CO2) Emissions Per Capita in Tonnes Per Year| Location | CO2 Emissions | CO2 Emissions Per Capita | CO2 Emissions Intensity |
|---|---|---|---|
| West Hamlin, West Virginia | 11,473 tn | 17.9 tn | 20,926 tons/mi² |
| West Virginia | 36,783,545 tn | 19.7 tn | 1,518 tons/mi² |
| United States | 5,664,619,809 tn | 17.6 tn | 1,491 tons/mi² |
West Hamlin, West Virginia CO2 Emissions
| 2013 CO2 emissions (tonnes/year) | 11,473 tn |
| 2013 CO2 emissions (tonnes/year) per capita | 17.9 tn |
| 2013 CO2 emissions intensity (tonnes/mi²/year) |
Natural Hazards Risk
Relative risk out of 10| Cyclone | Medium (5) |
| Flood | High (10) |
* Risk, particularly concerning flood or landslide, may not be for the entire area.
Sources: 1. Dilley, M., R.S. Chen, U. Deichmann, A.L. Lerner-Lam, M. Arnold, J. Agwe, P. Buys, O. Kjekstad, B. Lyon, and G. Yetman. 2005. Natural Disaster Hotspots: A Global Risk Analysis. Washington, D.C.: World Bank. https://doi.org/10.1596/0-8213-5930-4.
2. Center for Hazards and Risk Research - CHRR - Columbia University, Center for International Earth Science Information Network - CIESIN - Columbia University. 2005. Global Flood Hazard Frequency and Distribution. Palisades, NY: NASA Socioeconomic Data and Applications Center (SEDAC). https://doi.org/10.7927/H4668B3D.
3. Center for Hazards and Risk Research - CHRR - Columbia University, Center for International Earth Science Information Network - CIESIN - Columbia University, International Bank for Reconstruction and Development - The World Bank, and United Nations Environment Programme Global Resource Information Database Geneva - UNEP/GRID-Geneva. 2005. Global Cyclone Hazard Frequency and Distribution. Palisades, NY: NASA Socioeconomic Data and Applications Center (SEDAC). https://doi.org/10.7927/H4CZ353K.
Recent Nearby Earthquakes
Magnitude 3.0 and greater| Date | Time | Magnitude | Distance | Depth | Location | Link |
|---|---|---|---|---|---|---|
| 4/24/09 | 6:42 AM | 3.3 | 58.6 km | 5,000 m | 13km NW of Gallipolis, Ohio | usgs.gov |
| 6/28/91 | 11:34 AM | 3.2 | 46.2 km | 5,000 m | West Virginia | usgs.gov |
| 8/17/83 | 7:04 AM | 3.1 | 64.5 km | 10,000 m | 13km SSW of Greenup, Kentucky | usgs.gov |
| 8/17/83 | 7:03 AM | 3.5 | 54.4 km | 11,900 m | eastern Kentucky | usgs.gov |
| 11/9/79 | 1:29 PM | 3.6 | 61.8 km | 10,000 m | eastern Kentucky | usgs.gov |
| 2/16/75 | 3:21 PM | 3.3 | 87.1 km | 5,000 m | Ohio | usgs.gov |
| 11/5/26 | 8:53 AM | 3.8 | 90.8 km | None | Ohio | usgs.gov |
| 5/16/01 | 10:00 PM | 4.2 | 87 km | None | Ohio | usgs.gov |
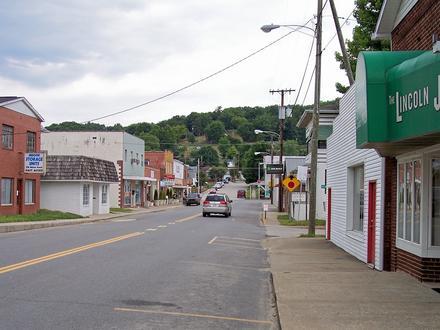
West Hamlin, West Virginia
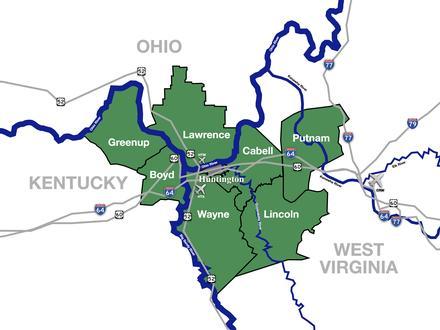
West Hamlin is a town in Lincoln County, West Virginia, United States, along the Guyandotte River. The population was 774 at the 2010 census. West Hamlin is a part of the Huntington-Ashland, WV-KY-OH, Metropolitan Statistical Area (MSA). As of the 20.. West Hamlin, West Virginia Wikipedia Page
About Our Data
The data on this page is estimated using a number of publicly available tools and resources. It is provided without warranty, and could contain inaccuracies. Use at your own risk. See here for more information.