Capurro Facts
| Area | 15.2 km² |
| Population | 85,602 |
| Male Population | 40,099 (46.8%) |
| Female Population | 45,503 (53.2%) |
| Population change (1975 to 2020) | +30.3% |
| Population change (2000 to 2020) | -0.1% |
| Median Age | 35.4 years (Male: 33.2, Female: 37.6) |
| Local Time | |
| Timezone | Uruguay Standard Time |
| Lat & Lng | -34.87678, -56.20039 |
Map of Capurro
Interactive Map
Capurro Population
Years 1975 to 2020
| Data | 1975 | 1990 | 2000 | 2015 | 2020 |
|---|---|---|---|---|---|
| Population | 65,681 | 81,601 | 85,671 | 84,584 | 85,602 |
| Population Density | 4,324.7 / km² | 5,372.9 / km² | 5,640.9 / km² | 5,569.3 / km² | 5,636.3 / km² |
Capurro Population change from 2000 to 2015
Decrease of 1.3% from year 2000 to 2015
| Location | Change since 1975 | Change since 1990 | Change since 2000 |
|---|---|---|---|
| Capurro | +28.8% | +3.7% | -1.3% |
| Montevideo Department | +36.1% | +5.9% | -0.6% |
| Uruguay | +21.1% | +10.3% | +3.3% |
Capurro Median Age
Median Age: 35.4 years
| Location | Median Age | Median Age (Female) | Median Age (Male) |
|---|---|---|---|
| Capurro | 35.4 yrs | 37.6 yrs | 33.2 yrs |
| Montevideo Department | 35.5 yrs | 37.8 yrs | 33.1 yrs |
| Uruguay | 34.4 yrs | 36.1 yrs | 32.7 yrs |
Capurro Population Density
Population Density: 5,636 / km²
| Location | Population | Area | Density |
|---|---|---|---|
| Capurro | 85,602 | 15.2 km² | 5,636 / km² |
| Montevideo Department | 1.4 million | 539.8 km² | 2,525 / km² |
| Uruguay | 3.4 million | 177,726.8 km² | 19.2 / km² |
Capurro Historical and Projected Population
Estimated Population from 1860 to 2100
- JRC (European Commission's Joint Research Centre) work on the GHS built-up grid
- CIESIN (Center for International Earth Science Information Network)
- [Link] Klein Goldewijk, K., Beusen, A., Doelman, J., and Stehfest, E.: Anthropogenic land use estimates for the Holocene – HYDE 3.2, Earth Syst. Sci. Data, 9, 927–953, https://doi.org/10.5194/essd-9-927-2017, 2017.
Human Development Index (HDI)
Statistic composite index of life expectancy, education, and per capita income.
Capurro CO2 Emissions
Carbon Dioxide (CO2) Emissions Per Capita in Tonnes Per Year
| Location | CO2 Emissions | CO2 Emissions Per Capita | CO2 Emissions Intensity |
|---|---|---|---|
| Capurro | 381,250 tn | 4.45 tn | 25,102.9 tons/km² |
| Montevideo Department | 6,001,838 tn | 4.4 tn | 11,119.2 tons/km² |
| Uruguay | 13,592,928 tn | 3.98 tn | 76.5 tons/km² |
| 2013 CO2 emissions (tonnes/year) | 381,250 tn |
| 2013 CO2 emissions (tonnes/year) per capita | 4.45 tn |
| 2013 CO2 emissions intensity (tonnes/km²/year) | 25,102.9 tons/km² |
Natural Hazards Risk
Relative risk out of 10
| Hazard | Risk Level |
|---|---|
| Flood | Medium (4) |
* Risk, particularly concerning flood or landslide, may not be for the entire area.
- Dilley, M., R.S. Chen, U. Deichmann, A.L. Lerner-Lam, M. Arnold, J. Agwe, P. Buys, O. Kjekstad, B. Lyon, and G. Yetman. 2005. Natural Disaster Hotspots: A Global Risk Analysis. Washington, D.C.: World Bank. https://doi.org/10.1596/0-8213-5930-4.
- Center for Hazards and Risk Research - CHRR - Columbia University, Center for International Earth Science Information Network - CIESIN - Columbia University. 2005. Global Flood Hazard Frequency and Distribution. Palisades, NY: NASA Socioeconomic Data and Applications Center (SEDAC). https://doi.org/10.7927/H4668B3D.
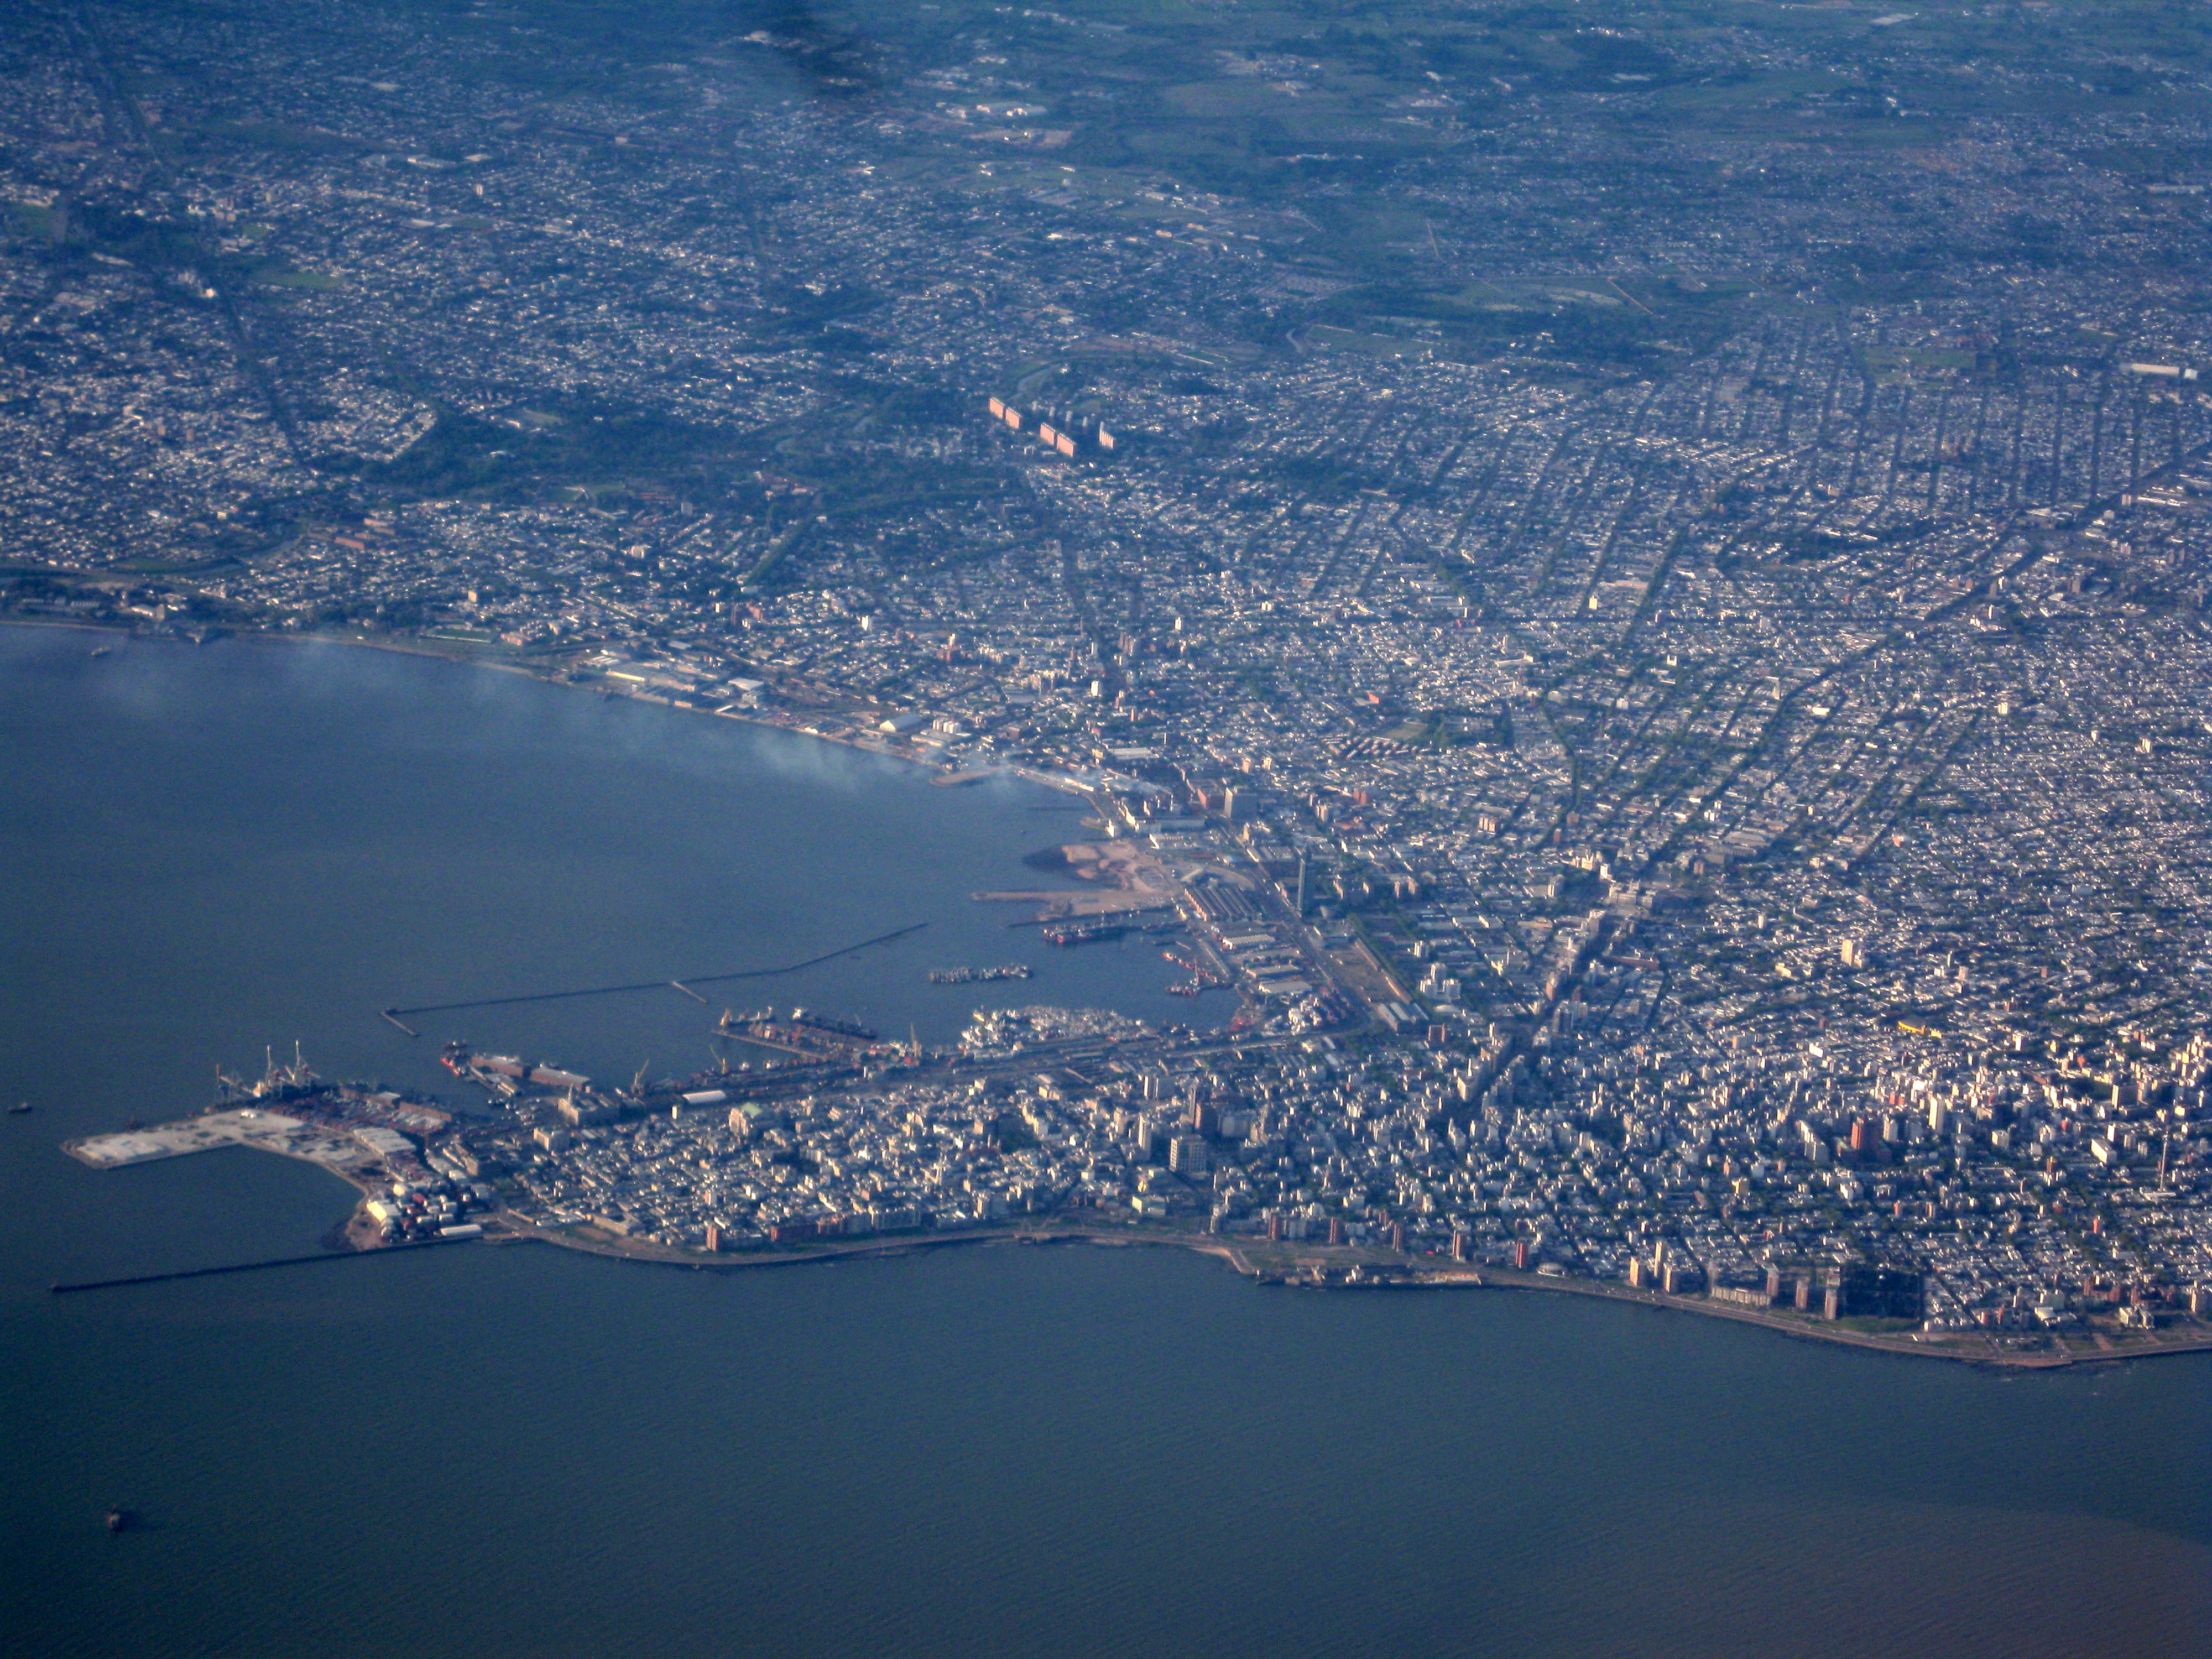
Capurro
Capurro is a barrio (neighbourhood or district) of Montevideo, Uruguay, and part of the Capurro / Bella Vista composite barrio, with Artigas Boulevard separating the two.
Capurro Wikipedia Page


About Our Data
The data on this page is estimated using a number of publicly available tools and resources. It is provided without warranty, and could contain inaccuracies. Use at your own risk.