Categories in Reducto
Car & Light Vehicle DealershipsCar Repair and MaintenanceCar WashChildren and baby clothingClothing storesFashion Accessories StoreShoe storesWomen's clothingAssociation or OrganizationCommunity CenterGovernment OfficeNon-Governmental OrganizationNon-Profit OrganizationPolitical organizationsReligious OrganizationYouth OrganizationComputer Repair ServiceCarpenterHardware storeEducationEducational InstitutionEducation CenterMartial Arts SchoolUniversities & CollegesEntertainment agenciesGraphic DesignerMovie theatersPhotographerStadiums and arenasBakeriesBars, pubs and tavernsCandy storesCatererConfectioneryDessert ShopFast food restaurantsGrocery stores and supermarketsHealth Food StorePizzaPubRestaurantsSpecialty & International FoodsAnimal and pet storesBeauty aidsEvent & Party RentalFurniture Repair ShopFurniture storesPet grooming and boardingLaw FirmAlternative medicineMedical clinicVeterinarianBarbersBeauty salonsBeauty & Skin CareHair SalonManicures and pedicuresMassagePet Care ServiceAdvertising AgencyBusiness Management ConsultantBusiness to Business ServiceCleaning ServiceMeeting Planning ServiceSecurity Guard ServiceApartment BuildingReal Estate AgencyReal Estate AgentsBook stores and newsstandsCosmetics StoreDepartment storesGift ShopRetail of Jewelry, Watches & Precious MetalsShoppingShopping MallShopping otherToy StoreDisco ClubGymSporting Goods StoreSports and recreationSports AssociationSports clubSports Instruction & TrainingAirportFreight forwardingTour AgencyTransportation ServiceTravel Agency
Industries
Business Distribution by Industry in Reducto
| Industry Description | Number of Establishments |
|---|---|
| Shopping | 15 |
| Real estate | 9 |
Reducto Facts
| Area | 2.3 km² |
| Population | 26,903 |
| Male Population | 12,357 (45.9%) |
| Female Population | 14,546 (54.1%) |
| Population change (1975 to 2020) | +42.1% |
| Population change (2000 to 2020) | +1.7% |
| Median Age | 35.5 years (Male: 33.4, Female: 38) |
| Neighborhoods | Reducto |
| Local Time | |
| Timezone | Uruguay Standard Time |
| Lat & Lng | -34.88333, -56.18333 |
| Postal Codes | 11800 |
Map of Reducto
Interactive Map
Reducto Population
Years 1975 to 2020
| Data | 1975 | 1990 | 2000 | 2015 | 2020 |
|---|---|---|---|---|---|
| Population | 18,937 | 24,608 | 26,450 | 26,608 | 26,903 |
| Population Density | 8,189 / km² | 10,641.3 / km² | 11,437.8 / km² | 11,506.2 / km² | 11,633.7 / km² |
Sources: JRC (European Commission's Joint Research Centre) work on the GHS built-up grid
Reducto Population change from 2000 to 2015
Increase of 0.6% from year 2000 to 2015
| Location | Change since 1975 | Change since 1990 | Change since 2000 |
|---|---|---|---|
| Reducto | +40.5% | +8.1% | +0.6% |
| Montevideo Department | +36.1% | +5.9% | -0.6% |
| Uruguay | +21.1% | +10.3% | +3.3% |
Sources: JRC (European Commission's Joint Research Centre) work on the GHS built-up grid
Reducto Median Age
Median Age: 35.5 years
| Location | Median Age | Median Age (Female) | Median Age (Male) |
|---|---|---|---|
| Reducto | 35.5 yrs | 38 yrs | 33.4 yrs |
| Montevideo Department | 35.5 yrs | 37.8 yrs | 33.1 yrs |
| Uruguay | 34.4 yrs | 36.1 yrs | 32.7 yrs |
Sources: CIESIN (Center for International Earth Science Information Network)
Reducto Population Density
Population Density: 11,634 / km²
| Location | Population | Area | Density |
|---|---|---|---|
| Reducto | 26,903 | 2.313 km² | 11,634 / km² |
| Montevideo Department | 1.4 million | 539.8 km² | 2,525 / km² |
| Uruguay | 3.4 million | 177,726.8 km² | 19.2 / km² |
Sources: JRC (European Commission's Joint Research Centre) work on the GHS built-up grid
Reducto Historical and Projected Population
Estimated Population from 1860 to 2100
Sources:
- JRC (European Commission's Joint Research Centre) work on the GHS built-up grid
- CIESIN (Center for International Earth Science Information Network)
- [Link] Klein Goldewijk, K., Beusen, A., Doelman, J., and Stehfest, E.: Anthropogenic land use estimates for the Holocene – HYDE 3.2, Earth Syst. Sci. Data, 9, 927–953, https://doi.org/10.5194/essd-9-927-2017, 2017.
Price Distribution
Business distribution by price for Reducto
Human Development Index (HDI)
Statistic composite index of life expectancy, education, and per capita income.
Source: [Link] Kummu, M., Taka, M. &Guillaume, J. Gridded global datasets for Gross Domestic Product and Human Development Index over 1990–2015. Sci Data 5, 180004 (2018) doi:10.1038/sdata.2018.4
Reducto CO2 Emissions
Carbon Dioxide (CO2) Emissions Per Capita in Tonnes Per Year
| Location | CO2 Emissions | CO2 Emissions Per Capita | CO2 Emissions Intensity |
|---|---|---|---|
| Reducto | 116,320 tn | 4.32 tn | 50,300.7 tons/km² |
| Montevideo Department | 6,001,838 tn | 4.4 tn | 11,119.2 tons/km² |
| Uruguay | 13,592,928 tn | 3.98 tn | 76.5 tons/km² |
Sources: [Link] Moran, D., Kanemoto K; Jiborn, M., Wood, R., Többen, J., and Seto, K.C. (2018) Carbon footprints of 13,000 cities. Environmental Research Letters DOI: 10.1088/1748-9326/aac72a
Reducto CO2 Emissions
| 2013 CO2 emissions (tonnes/year) | 116,320 tn |
| 2013 CO2 emissions (tonnes/year) per capita | 4.32 tn |
| 2013 CO2 emissions intensity (tonnes/km²/year) | 50,300.7 tons/km² |
Natural Hazards Risk
Relative risk out of 10
| Hazard | Risk Level |
|---|---|
| Flood | Medium (4) |
* Risk, particularly concerning flood or landslide, may not be for the entire area.
Sources:
- Dilley, M., R.S. Chen, U. Deichmann, A.L. Lerner-Lam, M. Arnold, J. Agwe, P. Buys, O. Kjekstad, B. Lyon, and G. Yetman. 2005. Natural Disaster Hotspots: A Global Risk Analysis. Washington, D.C.: World Bank. https://doi.org/10.1596/0-8213-5930-4.
- Center for Hazards and Risk Research - CHRR - Columbia University, Center for International Earth Science Information Network - CIESIN - Columbia University. 2005. Global Flood Hazard Frequency and Distribution. Palisades, NY: NASA Socioeconomic Data and Applications Center (SEDAC). https://doi.org/10.7927/H4668B3D.
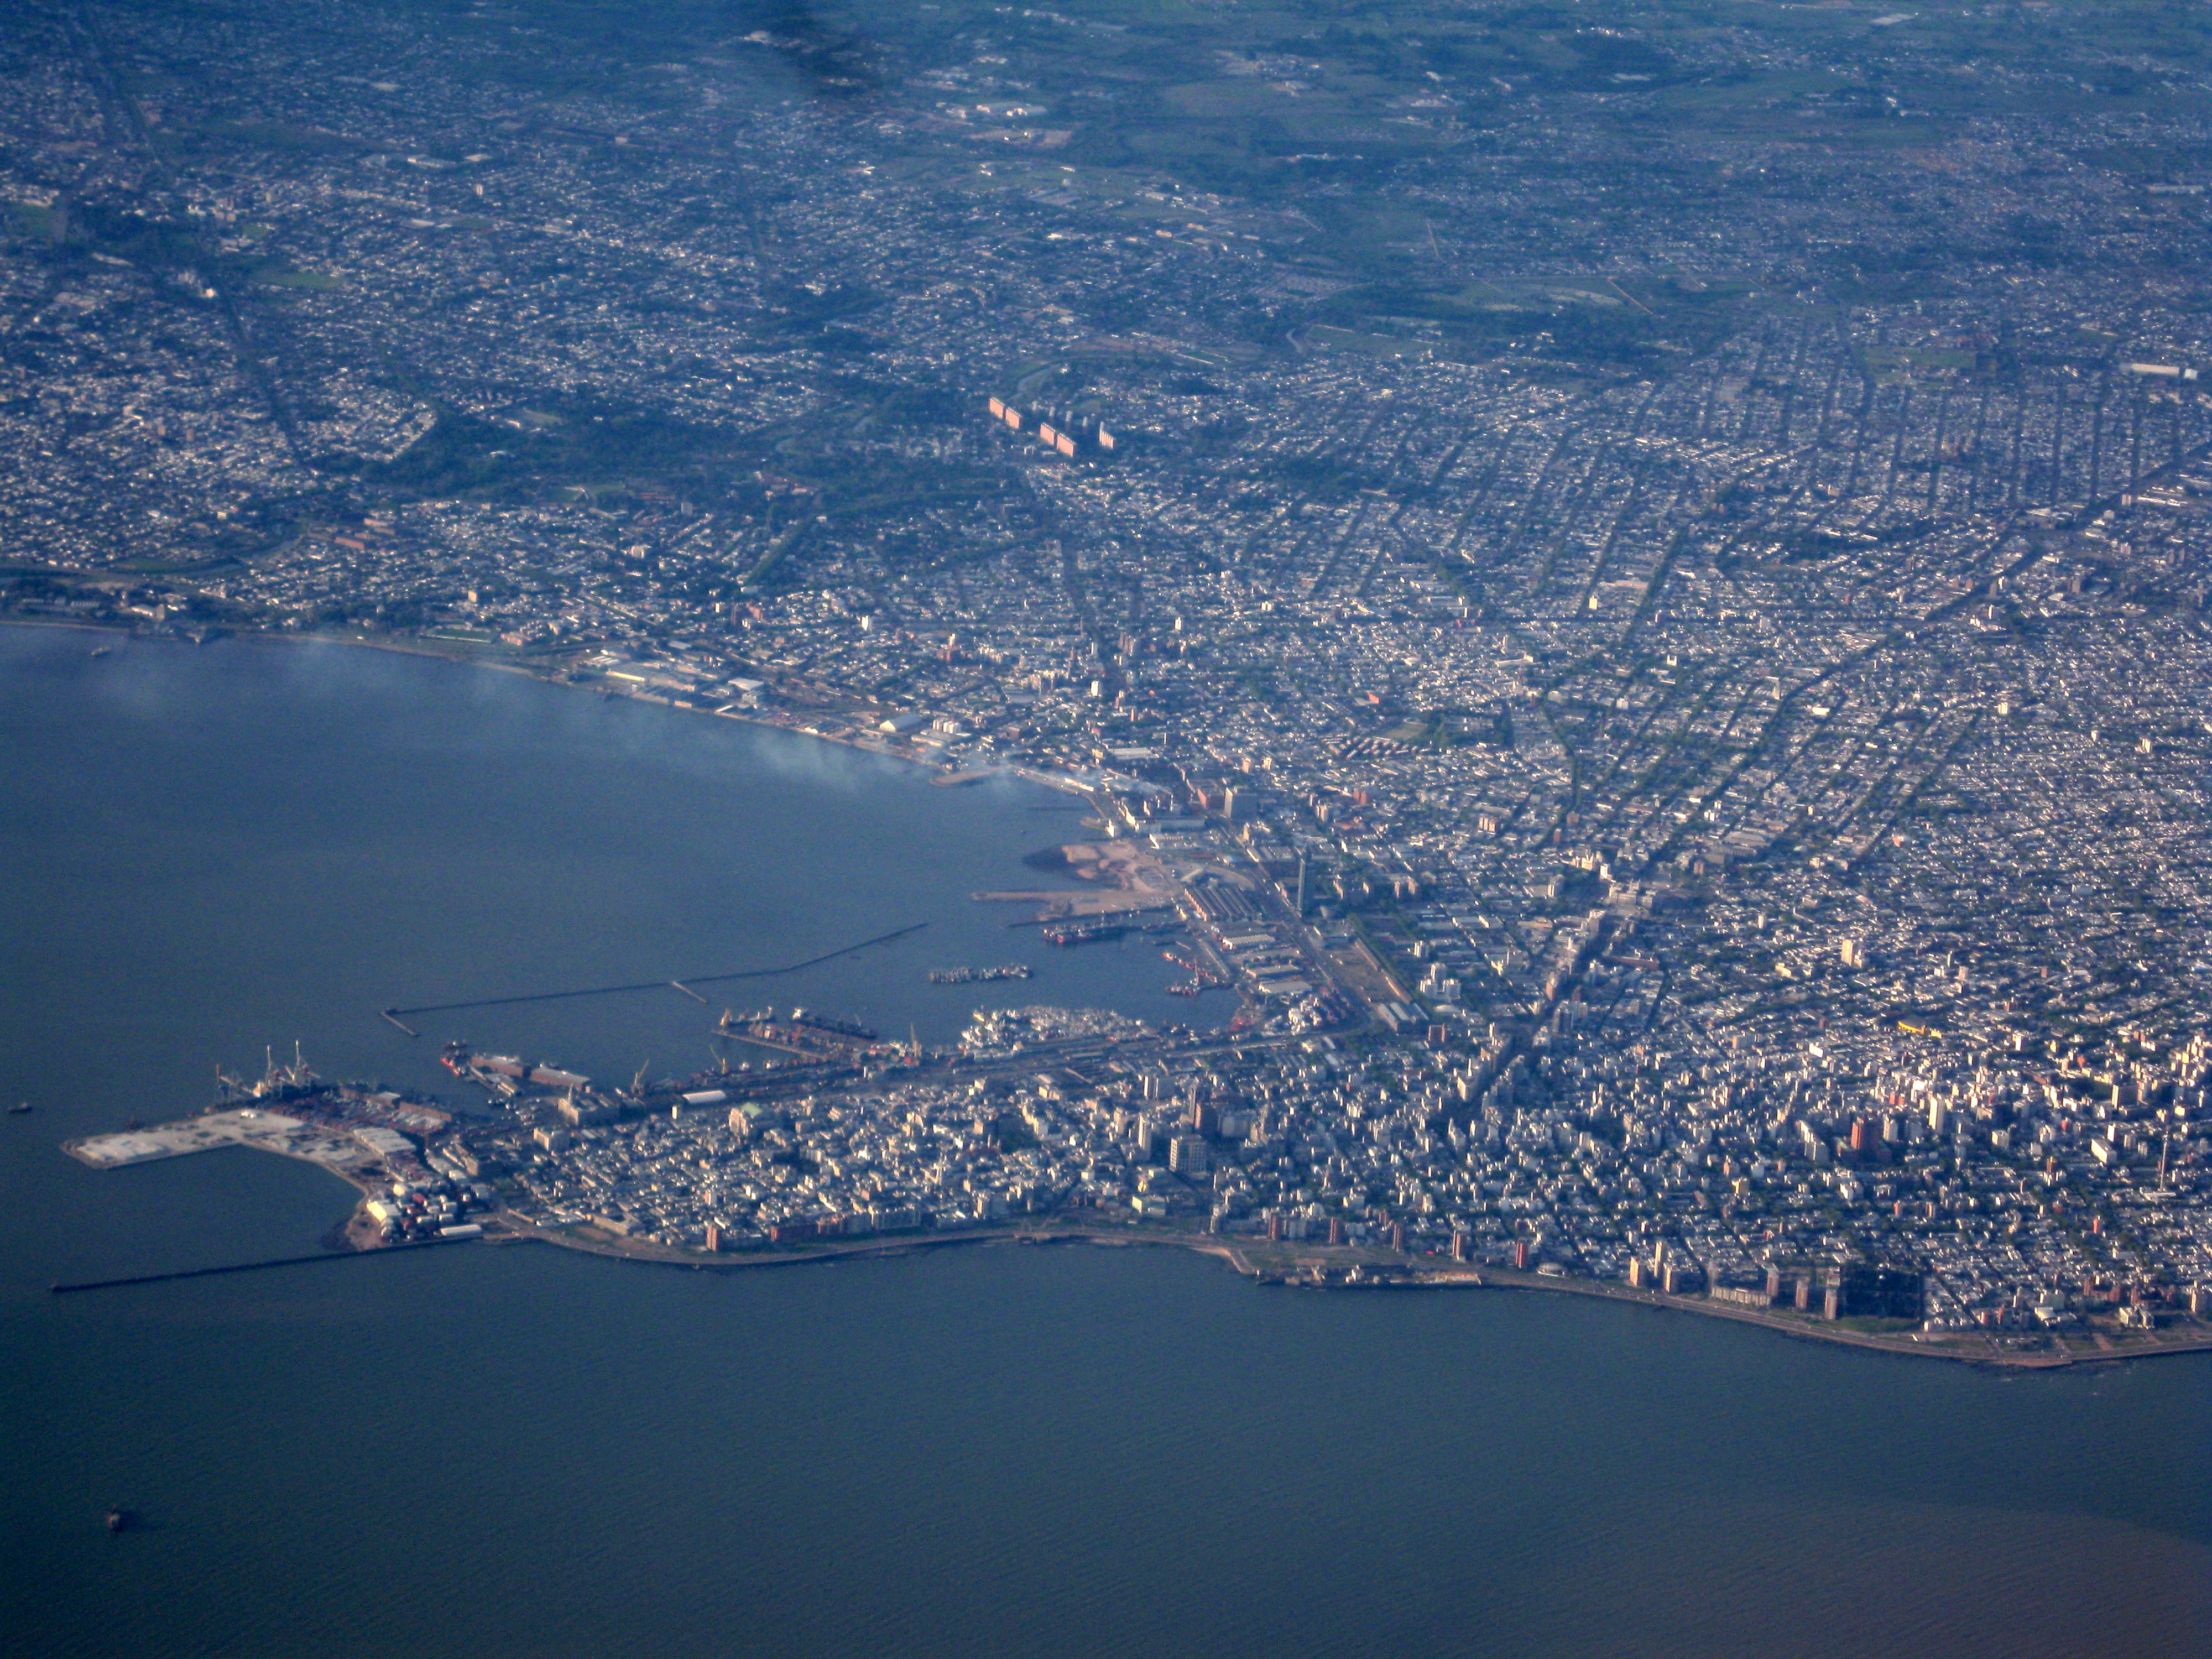
Reducto
Reducto is a barrio (neighbourhood or district) of Montevideo, Uruguay.
Reducto Wikipedia Page


About Our Data
The data on this page is estimated using a number of publicly available tools and resources. It is provided without warranty, and could contain inaccuracies. Use at your own risk.