Categories in Peć
Industries
Business Distribution by Industry in Peć
| Industry Description | Number of Establishments | Average Google Rating |
|---|---|---|
| Restaurants | 37 | 4.6 |
| Bars, pubs and taverns | 29 | 4.3 |
| Cafes | 24 | 4.6 |
| Office supplies and stationery stores | 13 | 5 |
| Mosques | 10 | 5 |
| Construction of buildings | 9 | 1 |
| Fast food restaurants | 9 | 3 |
| Education | 9 | — |
| Hotels and motels | 8 | 4.4 |
| American restaurants | 7 | — |
| Public parks | 6 | — |
| Sports and recreation | 6 | — |
| Other accommodation | 6 | 4.4 |
| Italian restaurants | 6 | 5 |
| Shopping | 6 | 4.2 |
| Bakeries | 6 | 5 |
| Other wholesale | 5 | — |
| Grocery stores and supermarkets | 5 | — |
| Hospitals | 5 | 5 |
| Other membership organizations | 5 | 5 |
Peć Facts
| Area | 10.9 km² |
| Population | 56,206 |
| Male Population | 28,104 (50.0%) |
| Female Population | 28,102 (50.0%) |
| Population change (1975 to 2020) | +58.6% |
| Population change (2000 to 2020) | +10.2% |
| Median Age | 28 years (Male: 26.9, Female: 29.1) |
| Neighborhoods | Kristali, Lagja Rrokaqielli |
| Local Time | |
| Timezone | Central European Summer Time |
| Lat & Lng | 42.65913, 20.28828 |
Map of Peć
Interactive Map
Peć Population
Years 1975 to 2020
| Data | 1975 | 1990 | 2000 | 2015 | 2020 |
|---|---|---|---|---|---|
| Population | 35,430 | 46,809 | 51,024 | 55,327 | 56,206 |
| Population Density | 3,257.9 / km² | 4,304.3 / km² | 4,691.9 / km² | 5,087.5 / km² | 5,168.4 / km² |
Peć Population change from 2000 to 2015
Increase of 8.4% from year 2000 to 2015
| Location | Change since 1975 | Change since 1990 | Change since 2000 |
|---|---|---|---|
| Peć | +56.2% | +18.2% | +8.4% |
| Kosovo | +129.3% | +50.3% | +24.1% |
Peć Median Age
Median Age: 28 years
| Location | Median Age | Median Age (Female) | Median Age (Male) |
|---|---|---|---|
| Peć | 28 yrs | 29.1 yrs | 26.9 yrs |
| Kosovo | 26.3 yrs | 27.2 yrs | 25.5 yrs |
Peć Population Density
Population Density: 5,168 / km²
| Location | Population | Area | Density |
|---|---|---|---|
| Peć | 56,206 | 10.9 km² | 5,168 / km² |
| Kosovo | 1.9 million | 10,902.7 km² | 173 / km² |
Peć Historical and Projected Population
Estimated Population from 1200 to 2100
- JRC (European Commission's Joint Research Centre) work on the GHS built-up grid
- CIESIN (Center for International Earth Science Information Network)
- [Link] Klein Goldewijk, K., Beusen, A., Doelman, J., and Stehfest, E.: Anthropogenic land use estimates for the Holocene – HYDE 3.2, Earth Syst. Sci. Data, 9, 927–953, https://doi.org/10.5194/essd-9-927-2017, 2017.
Price Distribution
Business distribution by price for Peć
Human Development Index (HDI)
Statistic composite index of life expectancy, education, and per capita income.
Peć CO2 Emissions
Carbon Dioxide (CO2) Emissions Per Capita in Tonnes Per Year
| Location | CO2 Emissions | CO2 Emissions Per Capita | CO2 Emissions Intensity |
|---|---|---|---|
| Peć | 307,517 tn | 5.47 tn | 28,277.4 tons/km² |
| Kosovo | 9,406,001 tn | 4.97 tn | 862.7 tons/km² |
| 2013 CO2 emissions (tonnes/year) | 307,517 tn |
| 2013 CO2 emissions (tonnes/year) per capita | 5.47 tn |
| 2013 CO2 emissions intensity (tonnes/km²/year) | 28,277.4 tons/km² |
Natural Hazards Risk
Relative risk out of 10
| Hazard | Risk Level |
|---|---|
| Flood | Medium (4) |
| Earthquake | Medium (4) |
| Landslide | Medium (6) |
* Risk, particularly concerning flood or landslide, may not be for the entire area.
- Dilley, M., R.S. Chen, U. Deichmann, A.L. Lerner-Lam, M. Arnold, J. Agwe, P. Buys, O. Kjekstad, B. Lyon, and G. Yetman. 2005. Natural Disaster Hotspots: A Global Risk Analysis. Washington, D.C.: World Bank. https://doi.org/10.1596/0-8213-5930-4.
- Center for Hazards and Risk Research - CHRR - Columbia University, Center for International Earth Science Information Network - CIESIN - Columbia University, and Norwegian Geotechnical Institute - NGI. 2005. Global Landslide Hazard Distribution. Palisades, NY: NASA Socioeconomic Data and Applications Center (SEDAC). https://doi.org/10.7927/H4P848VZ.
- Center for Hazards and Risk Research - CHRR - Columbia University, Center for International Earth Science Information Network - CIESIN - Columbia University. 2005. Global Flood Hazard Frequency and Distribution. Palisades, NY: NASA Socioeconomic Data and Applications Center (SEDAC). https://doi.org/10.7927/H4668B3D.
- Center for Hazards and Risk Research - CHRR - Columbia University, Center for International Earth Science Information Network - CIESIN - Columbia University. 2005. Global Earthquake Hazard Distribution - Peak Ground Acceleration. Palisades, NY: NASA Socioeconomic Data and Applications Center (SEDAC). https://doi.org/10.7927/H4BZ63ZS.
Recent Nearby Earthquakes
Magnitude 3.0 and greater
| Date▼ | Time↕ | Magnitude↕ | Distance↕ | Depth↕ | Location↕ | Link |
|---|---|---|---|---|---|---|
| 2/11/18 | 1:05 PM | 4.4 | 30.5 km | 8,080 m | 30km W of Peje, Kosovo | usgs.gov |
| 1/4/18 | 10:46 AM | 5.1 | 34.9 km | 10,000 m | 33km ESE of Kolasin, Montenegro | usgs.gov |
| 1/21/15 | 1:30 AM | 4.4 | 11.3 km | 11,490 m | 3km N of Dubovo, Kosovo | usgs.gov |
| 11/28/12 | 1:49 AM | 4.1 | 26.4 km | 9,000 m | Albania | usgs.gov |
| 3/10/10 | 1:38 PM | 4.6 | 25.6 km | 10,000 m | Kosovo | usgs.gov |
| 7/24/07 | 6:18 PM | 3.2 | 44.6 km | 800 m | Serbia | usgs.gov |
| 9/27/06 | 12:37 AM | 3.9 | 43.7 km | 1,300 m | Albania | usgs.gov |
| 11/10/05 | 11:37 AM | 3.1 | 23.6 km | 10,000 m | Montenegro | usgs.gov |
| 8/23/05 | 1:14 AM | 3.1 | 11.5 km | 7,300 m | Kosovo | usgs.gov |
| 8/23/05 | 1:13 AM | 3.3 | 14.2 km | 11,000 m | Montenegro | usgs.gov |
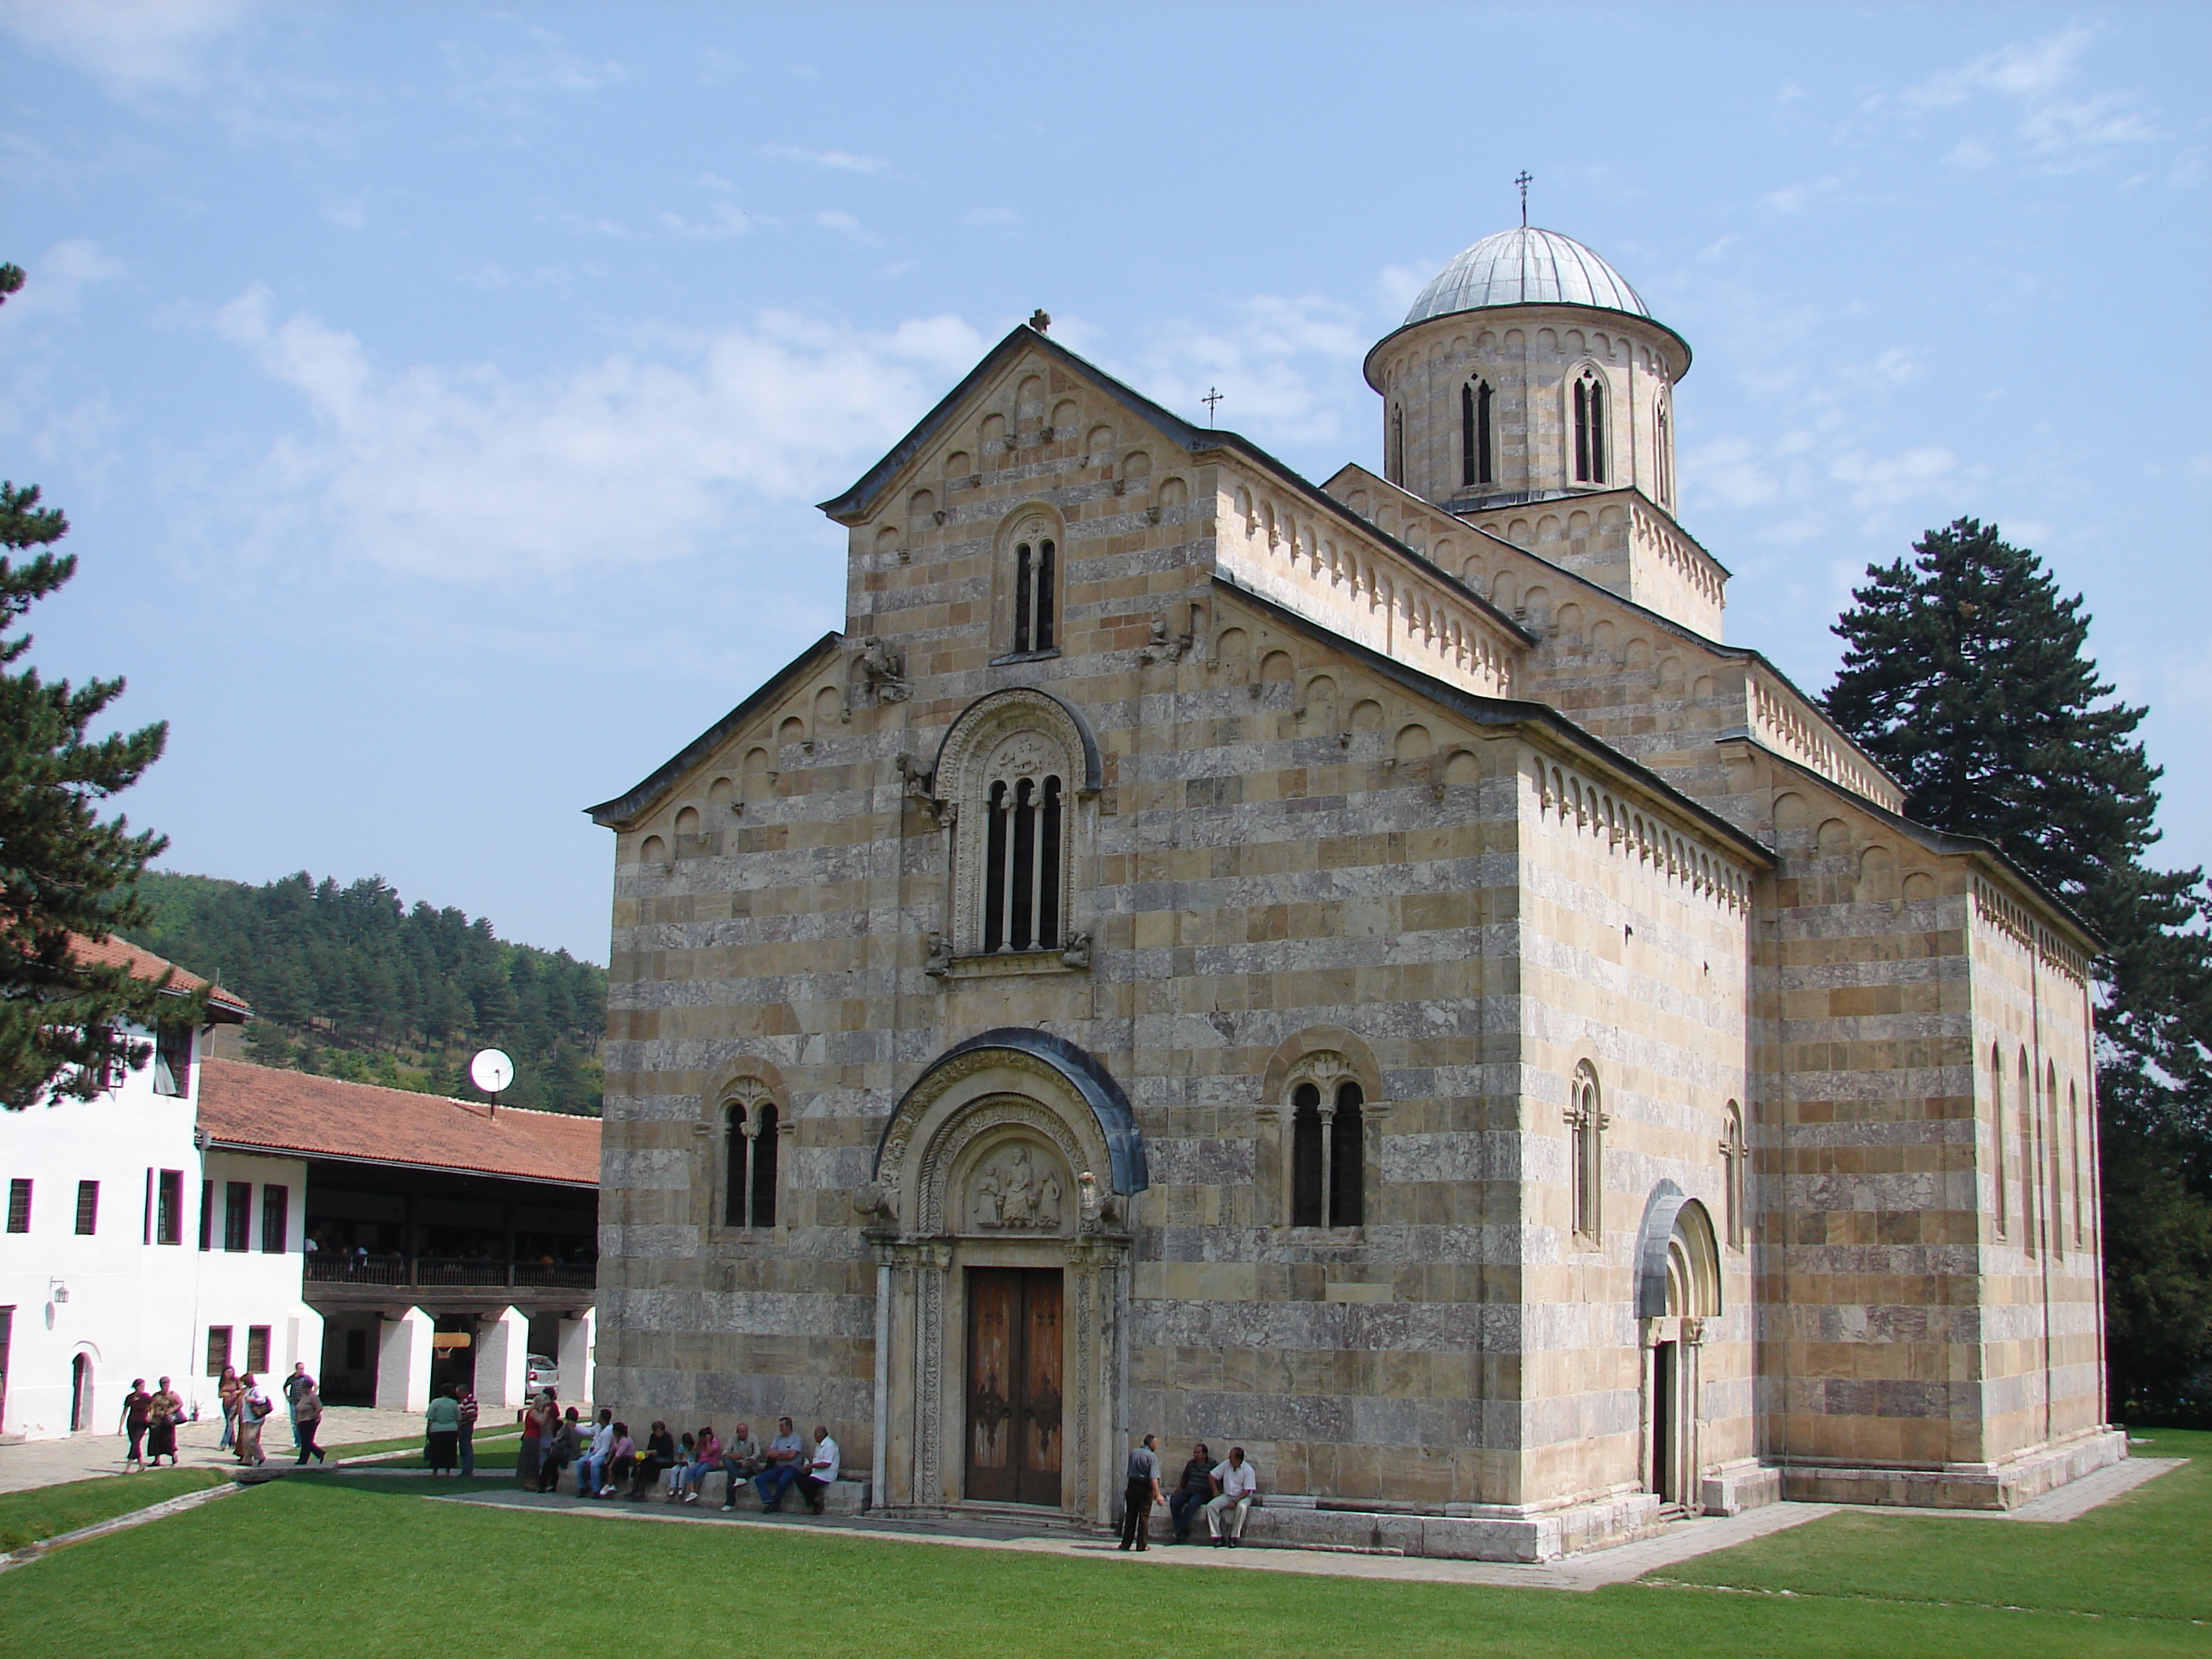
Peć
Peć (Serbian: Пећ or Peć or Pejë (Albanian: Peja or Pejë)) is a city in western Kosovo, and the administrative centre of the same name. The municipality covers an area of 602 km2 (232 sq mi), including the city of Peć and 95 villages; it is divided i..
Peć Wikipedia Page


About Our Data
The data on this page is estimated using a number of publicly available tools and resources. It is provided without warranty, and could contain inaccuracies. Use at your own risk.