Industries
Business Distribution by Industry in Dewetsdorp
| Industry Description | Number of Establishments | Average Google Rating |
|---|---|---|
| Education | 38 | 3.9 |
| Primary and elementary schools | 31 | 2 |
| Preschools and kindergartens | 30 | 2 |
Dewetsdorp Facts
| Area | 4.2 km² |
| Population | 8,744 |
| Male Population | 3,976 (45.5%) |
| Female Population | 4,768 (54.5%) |
| Population change (1975 to 2020) | -15.5% |
| Population change (2000 to 2020) | -14.7% |
| Median Age | 23.2 years (Male: 20.8, Female: 25.4) |
| Neighborhoods | Dewetsdorp, Morojaneng, Stretford |
| Local Time | |
| Timezone | South Africa Standard Time |
| Lat & Lng | -29.58274, 26.66511 |
Map of Dewetsdorp
Interactive Map
Dewetsdorp Population
Years 1975 to 2020
| Data | 1975 | 1990 | 2000 | 2015 | 2020 |
|---|---|---|---|---|---|
| Population | 10,350 | 10,529 | 10,253 | 8,295 | 8,744 |
| Population Density | 2,471.6 / km² | 2,514.4 / km² | 2,448.5 / km² | 1,980.9 / km² | 2,088.1 / km² |
Dewetsdorp Population change from 2000 to 2015
Decrease of 19.1% from year 2000 to 2015
| Location | Change since 1975 | Change since 1990 | Change since 2000 |
|---|---|---|---|
| Dewetsdorp | -19.9% | -21.2% | -19.1% |
| Free State (province) | +29.9% | +7.4% | -0.4% |
| South Africa | +111.9% | +48.1% | +21.4% |
Dewetsdorp Median Age
Median Age: 23.2 years
| Location | Median Age | Median Age (Female) | Median Age (Male) |
|---|---|---|---|
| Dewetsdorp | 23.2 yrs | 25.4 yrs | 20.8 yrs |
| Free State (province) | 25.6 yrs | 26.6 yrs | 24.6 yrs |
| South Africa | 25.4 yrs | 26.3 yrs | 24.5 yrs |
Dewetsdorp Population Density
Population Density: 2,088 / km²
| Location | Population | Area | Density |
|---|---|---|---|
| Dewetsdorp | 8,744 | 4.188 km² | 2,088 / km² |
| Free State (province) | 2.7 million | 129,825.2 km² | 21.2 / km² |
| South Africa | 54.3 million | 1,219,846.5 km² | 44.5 / km² |
Dewetsdorp Historical and Projected Population
Estimated Population from 1200 to 2100
- JRC (European Commission's Joint Research Centre) work on the GHS built-up grid
- CIESIN (Center for International Earth Science Information Network)
- [Link] Klein Goldewijk, K., Beusen, A., Doelman, J., and Stehfest, E.: Anthropogenic land use estimates for the Holocene – HYDE 3.2, Earth Syst. Sci. Data, 9, 927–953, https://doi.org/10.5194/essd-9-927-2017, 2017.
Neighborhoods in Dewetsdorp
Percentage of businesses by neighborhood in Dewetsdorp
Area Codes
Percentage Area Codes used by businesses in Dewetsdorp
Human Development Index (HDI)
Statistic composite index of life expectancy, education, and per capita income.
Dewetsdorp CO2 Emissions
Carbon Dioxide (CO2) Emissions Per Capita in Tonnes Per Year
| Location | CO2 Emissions | CO2 Emissions Per Capita | CO2 Emissions Intensity |
|---|---|---|---|
| Dewetsdorp | 54,834 tn | 6.27 tn | 13,094.7 tons/km² |
| Free State (province) | 17,793,024 tn | 6.47 tn | 137.1 tons/km² |
| South Africa | 358,473,408 tn | 6.6 tn | 293.9 tons/km² |
| 2013 CO2 emissions (tonnes/year) | 54,834 tn |
| 2013 CO2 emissions (tonnes/year) per capita | 6.27 tn |
| 2013 CO2 emissions intensity (tonnes/km²/year) | 13,094.7 tons/km² |
Natural Hazards Risk
Relative risk out of 10
| Hazard | Risk Level |
|---|---|
| Drought | Medium (5) |
* Risk, particularly concerning flood or landslide, may not be for the entire area.
- Dilley, M., R.S. Chen, U. Deichmann, A.L. Lerner-Lam, M. Arnold, J. Agwe, P. Buys, O. Kjekstad, B. Lyon, and G. Yetman. 2005. Natural Disaster Hotspots: A Global Risk Analysis. Washington, D.C.: World Bank. https://doi.org/10.1596/0-8213-5930-4.
- Center for Hazards and Risk Research - CHRR - Columbia University, Center for International Earth Science Information Network - CIESIN - Columbia University, and International Research Institute for Climate and Society - IRI - Columbia University. 2005. Global Drought Hazard Frequency and Distribution. Palisades, NY: NASA Socioeconomic Data and Applications Center (SEDAC). https://doi.org/10.7927/H4VX0DFT.
Recent Nearby Earthquakes
Magnitude 3.0 and greater
| Date▼ | Time↕ | Magnitude↕ | Distance↕ | Depth↕ | Location↕ | Link |
|---|---|---|---|---|---|---|
| 9/15/17 | 1:31 PM | 4.4 | 45 km | 5,000 m | 58km S of Bloemfontein, South Africa | usgs.gov |
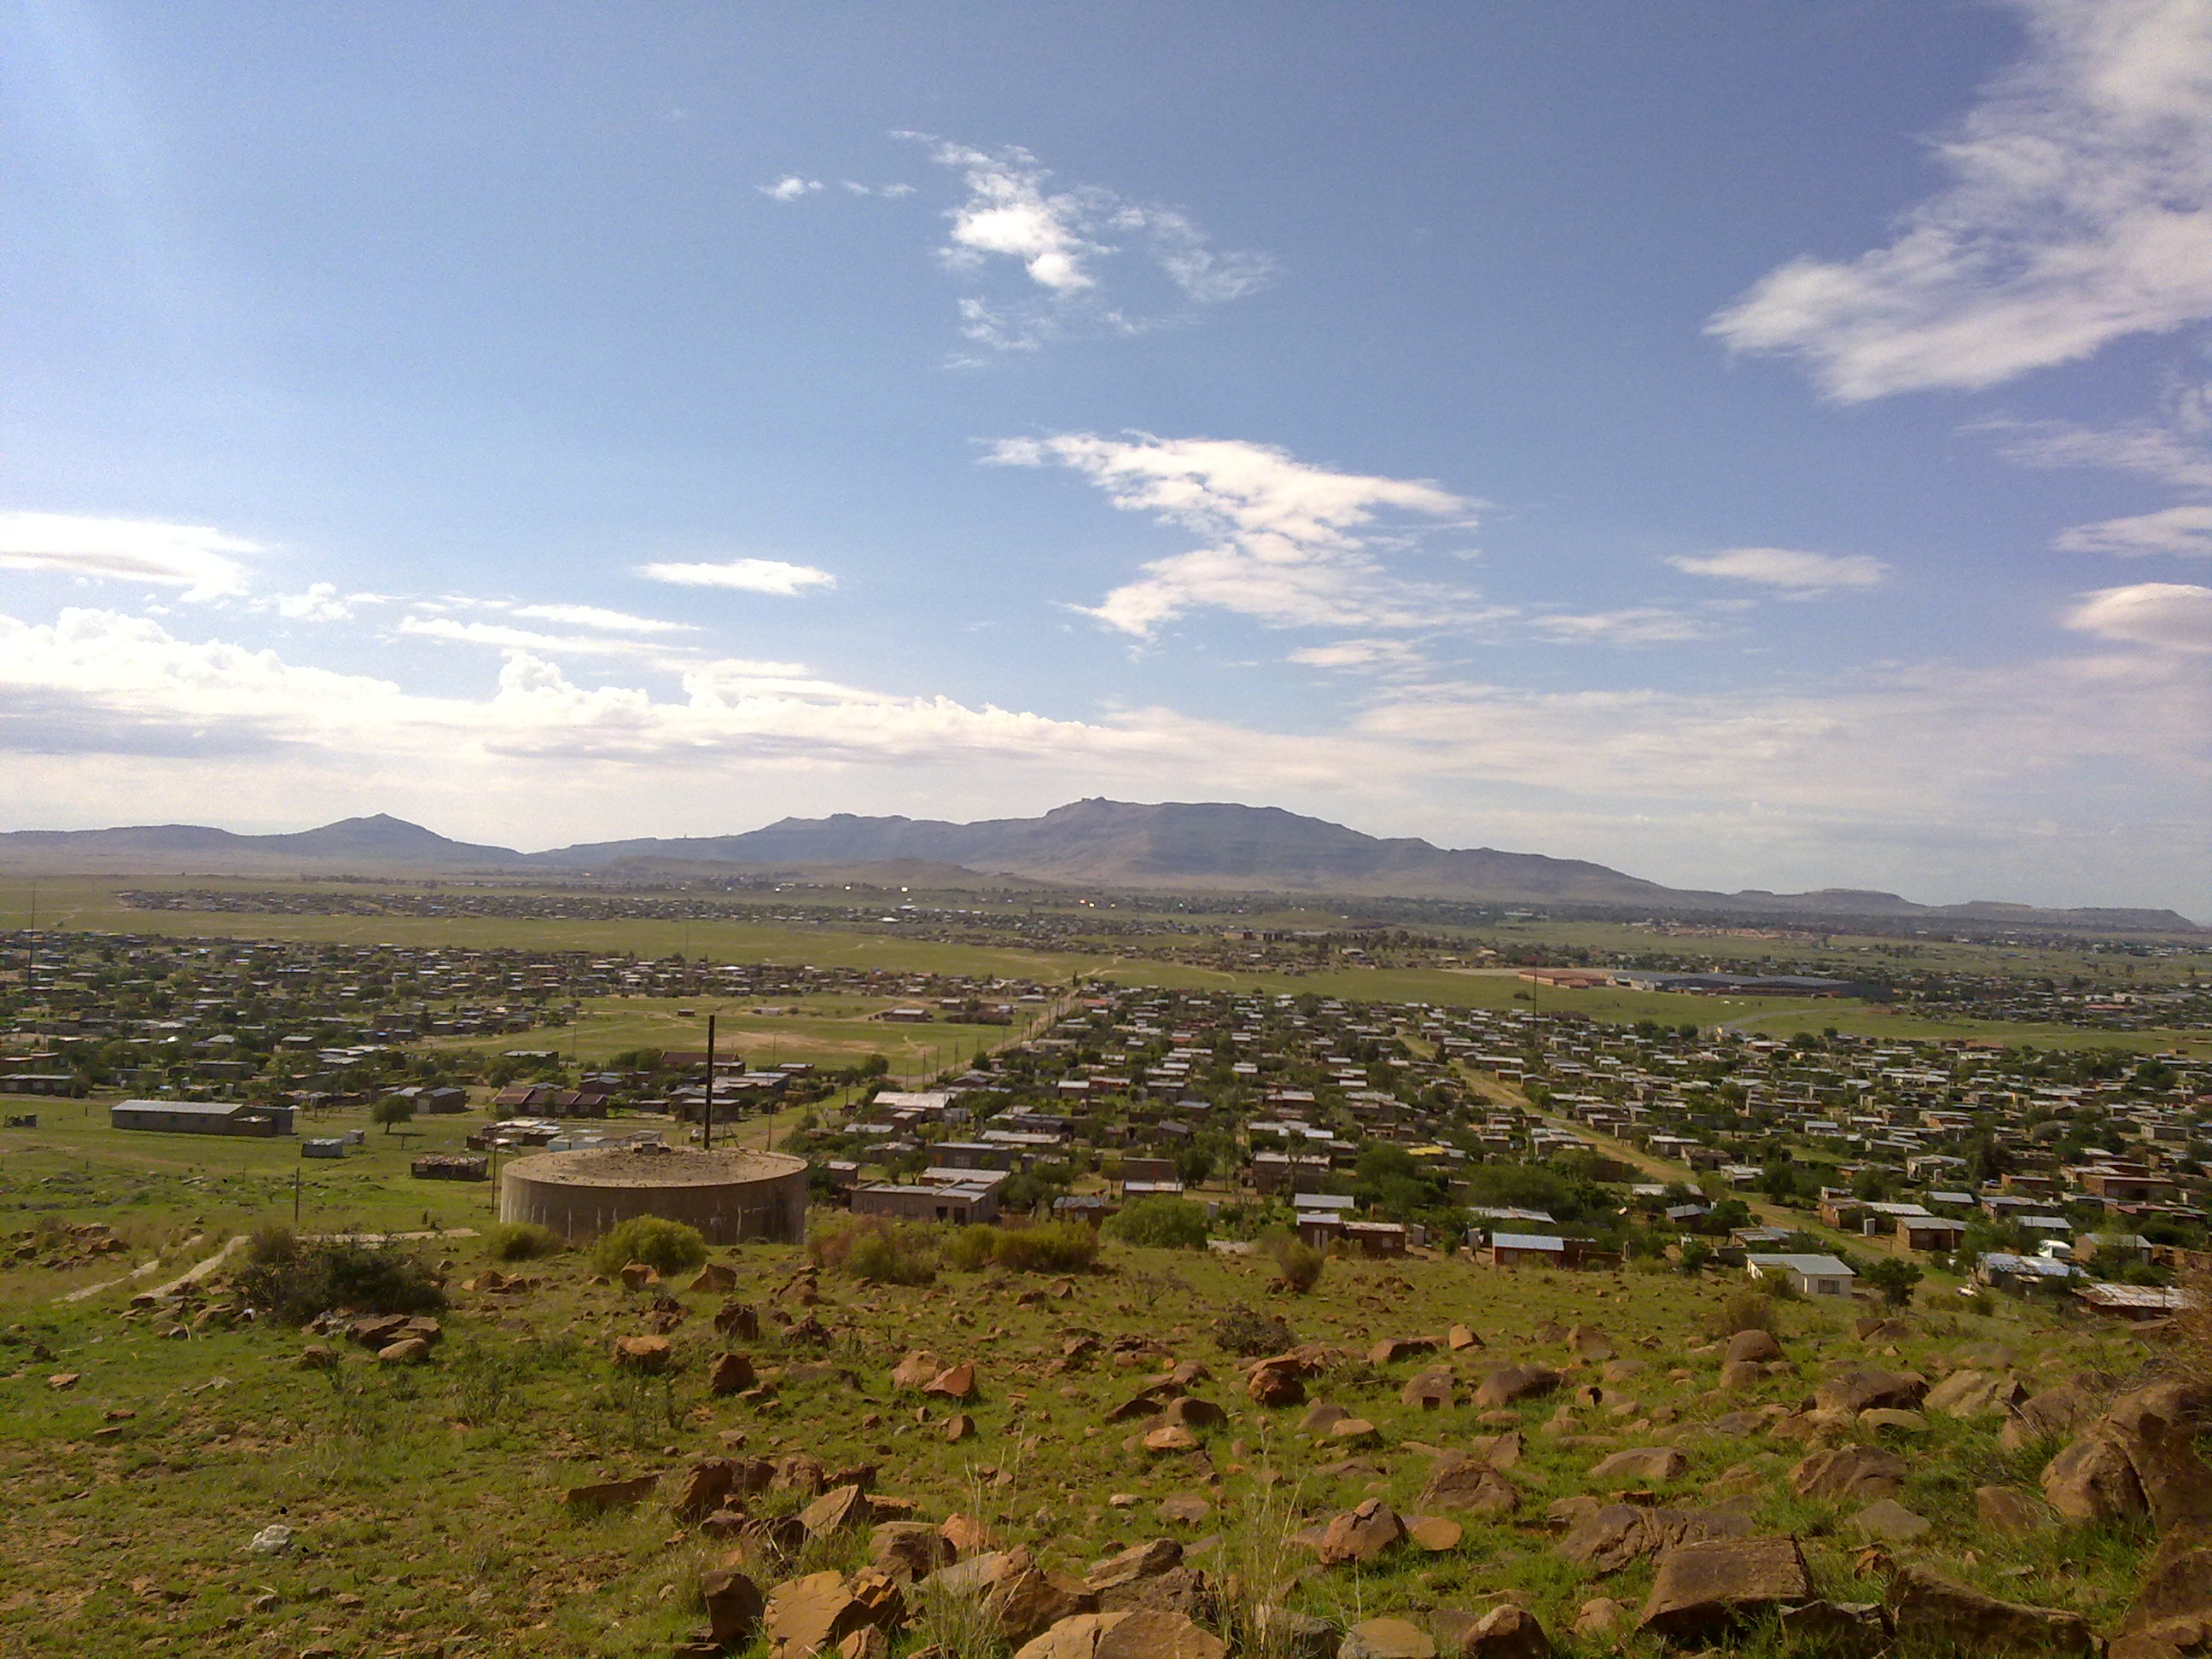
Dewetsdorp
Dewetsdorp is a small town in the Free State province of South Africa. The town was set up, without approval of the Volksraad, by field-cornet Jacobus de Wet, father of the Boer War general Christiaan de Wet. Eventually recognized officially, the tow..
Dewetsdorp Wikipedia Page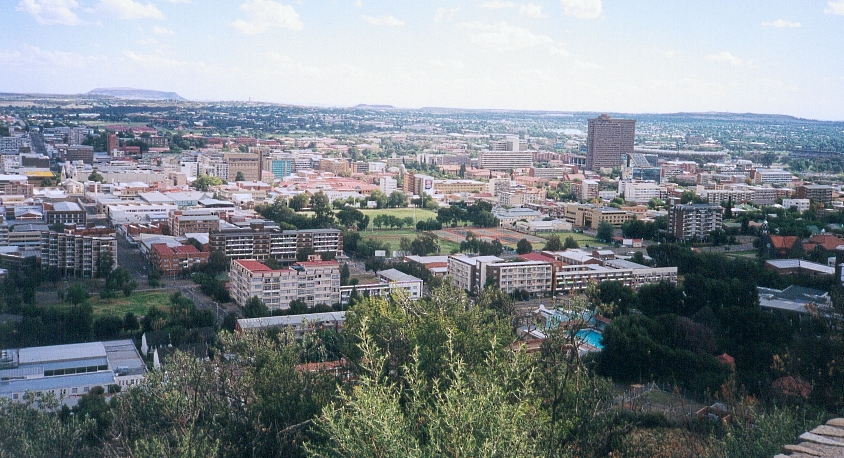

About Our Data
The data on this page is estimated using a number of publicly available tools and resources. It is provided without warranty, and could contain inaccuracies. Use at your own risk.