Categories in Durnacol
Industries
Business Distribution by Industry in Durnacol
| Industry Description | Number of Establishments |
|---|---|
| Education | 11 |
| Preschools and kindergartens | 7 |
Durnacol Facts
| Area | 2.4 km² |
| Population | 2,114 |
| Male Population | 1,067 (50.5%) |
| Female Population | 1,047 (49.5%) |
| Population change (1975 to 2020) | +38.1% |
| Population change (2000 to 2020) | +0.2% |
| Median Age | 22.9 years (Male: 21.4, Female: 24.9) |
| Neighborhoods | Mbanane, Durnacol |
| Local Time | |
| Timezone | South Africa Standard Time |
| Lat & Lng | -28.04912, 30.01763 |
| Postal Codes | 3082 |
Map of Durnacol
Interactive Map
Durnacol Population
Years 1975 to 2020
| Data | 1975 | 1990 | 2000 | 2015 | 2020 |
|---|---|---|---|---|---|
| Population | 1,531 | 1,976 | 2,110 | 2,051 | 2,114 |
| Population Density | 644.6 / km² | 832 / km² | 888.4 / km² | 863.6 / km² | 890.1 / km² |
Durnacol Population change from 2000 to 2015
Decrease of 2.8% from year 2000 to 2015
| Location | Change since 1975 | Change since 1990 | Change since 2000 |
|---|---|---|---|
| Durnacol | +34% | +3.8% | -2.8% |
| KwaZulu-Natal | +61.9% | +23.2% | +8% |
| South Africa | +111.9% | +48.1% | +21.4% |
Durnacol Median Age
Median Age: 22.9 years
| Location | Median Age | Median Age (Female) | Median Age (Male) |
|---|---|---|---|
| Durnacol | 22.9 yrs | 24.9 yrs | 21.4 yrs |
| KwaZulu-Natal | 23.3 yrs | 24.5 yrs | 22.1 yrs |
| South Africa | 25.4 yrs | 26.3 yrs | 24.5 yrs |
Durnacol Population Density
Population Density: 890 / km²
| Location | Population | Area | Density |
|---|---|---|---|
| Durnacol | 2,114 | 2.375 km² | 890 / km² |
| KwaZulu-Natal | 10.4 million | 94,361.3 km² | 111 / km² |
| South Africa | 54.3 million | 1,219,846.5 km² | 44.5 / km² |
Durnacol Historical and Projected Population
Estimated Population from 1850 to 2100
- JRC (European Commission's Joint Research Centre) work on the GHS built-up grid
- CIESIN (Center for International Earth Science Information Network)
- [Link] Klein Goldewijk, K., Beusen, A., Doelman, J., and Stehfest, E.: Anthropogenic land use estimates for the Holocene – HYDE 3.2, Earth Syst. Sci. Data, 9, 927–953, https://doi.org/10.5194/essd-9-927-2017, 2017.
Human Development Index (HDI)
Statistic composite index of life expectancy, education, and per capita income.
Durnacol CO2 Emissions
Carbon Dioxide (CO2) Emissions Per Capita in Tonnes Per Year
| Location | CO2 Emissions | CO2 Emissions Per Capita | CO2 Emissions Intensity |
|---|---|---|---|
| Durnacol | 12,519 tn | 5.92 tn | 5,271.2 tons/km² |
| KwaZulu-Natal | 59,080,989 tn | 5.66 tn | 626.1 tons/km² |
| South Africa | 358,473,408 tn | 6.6 tn | 293.9 tons/km² |
| 2013 CO2 emissions (tonnes/year) | 12,519 tn |
| 2013 CO2 emissions (tonnes/year) per capita | 5.92 tn |
| 2013 CO2 emissions intensity (tonnes/km²/year) | 5,271.2 tons/km² |
Natural Hazards Risk
Relative risk out of 10
| Hazard | Risk Level |
|---|---|
| Drought | Medium (4) |
| Flood | High (9) |
* Risk, particularly concerning flood or landslide, may not be for the entire area.
- Dilley, M., R.S. Chen, U. Deichmann, A.L. Lerner-Lam, M. Arnold, J. Agwe, P. Buys, O. Kjekstad, B. Lyon, and G. Yetman. 2005. Natural Disaster Hotspots: A Global Risk Analysis. Washington, D.C.: World Bank. https://doi.org/10.1596/0-8213-5930-4.
- Center for Hazards and Risk Research - CHRR - Columbia University, Center for International Earth Science Information Network - CIESIN - Columbia University, and International Research Institute for Climate and Society - IRI - Columbia University. 2005. Global Drought Hazard Frequency and Distribution. Palisades, NY: NASA Socioeconomic Data and Applications Center (SEDAC). https://doi.org/10.7927/H4VX0DFT.
- Center for Hazards and Risk Research - CHRR - Columbia University, Center for International Earth Science Information Network - CIESIN - Columbia University. 2005. Global Flood Hazard Frequency and Distribution. Palisades, NY: NASA Socioeconomic Data and Applications Center (SEDAC). https://doi.org/10.7927/H4668B3D.
Recent Nearby Earthquakes
Magnitude 3.0 and greater
| Date▼ | Time↕ | Magnitude↕ | Distance↕ | Depth↕ | Location↕ | Link |
|---|---|---|---|---|---|---|
| 10/11/93 | 2:06 PM | 3.3 | 81 km | 5,000 m | South Africa | usgs.gov |
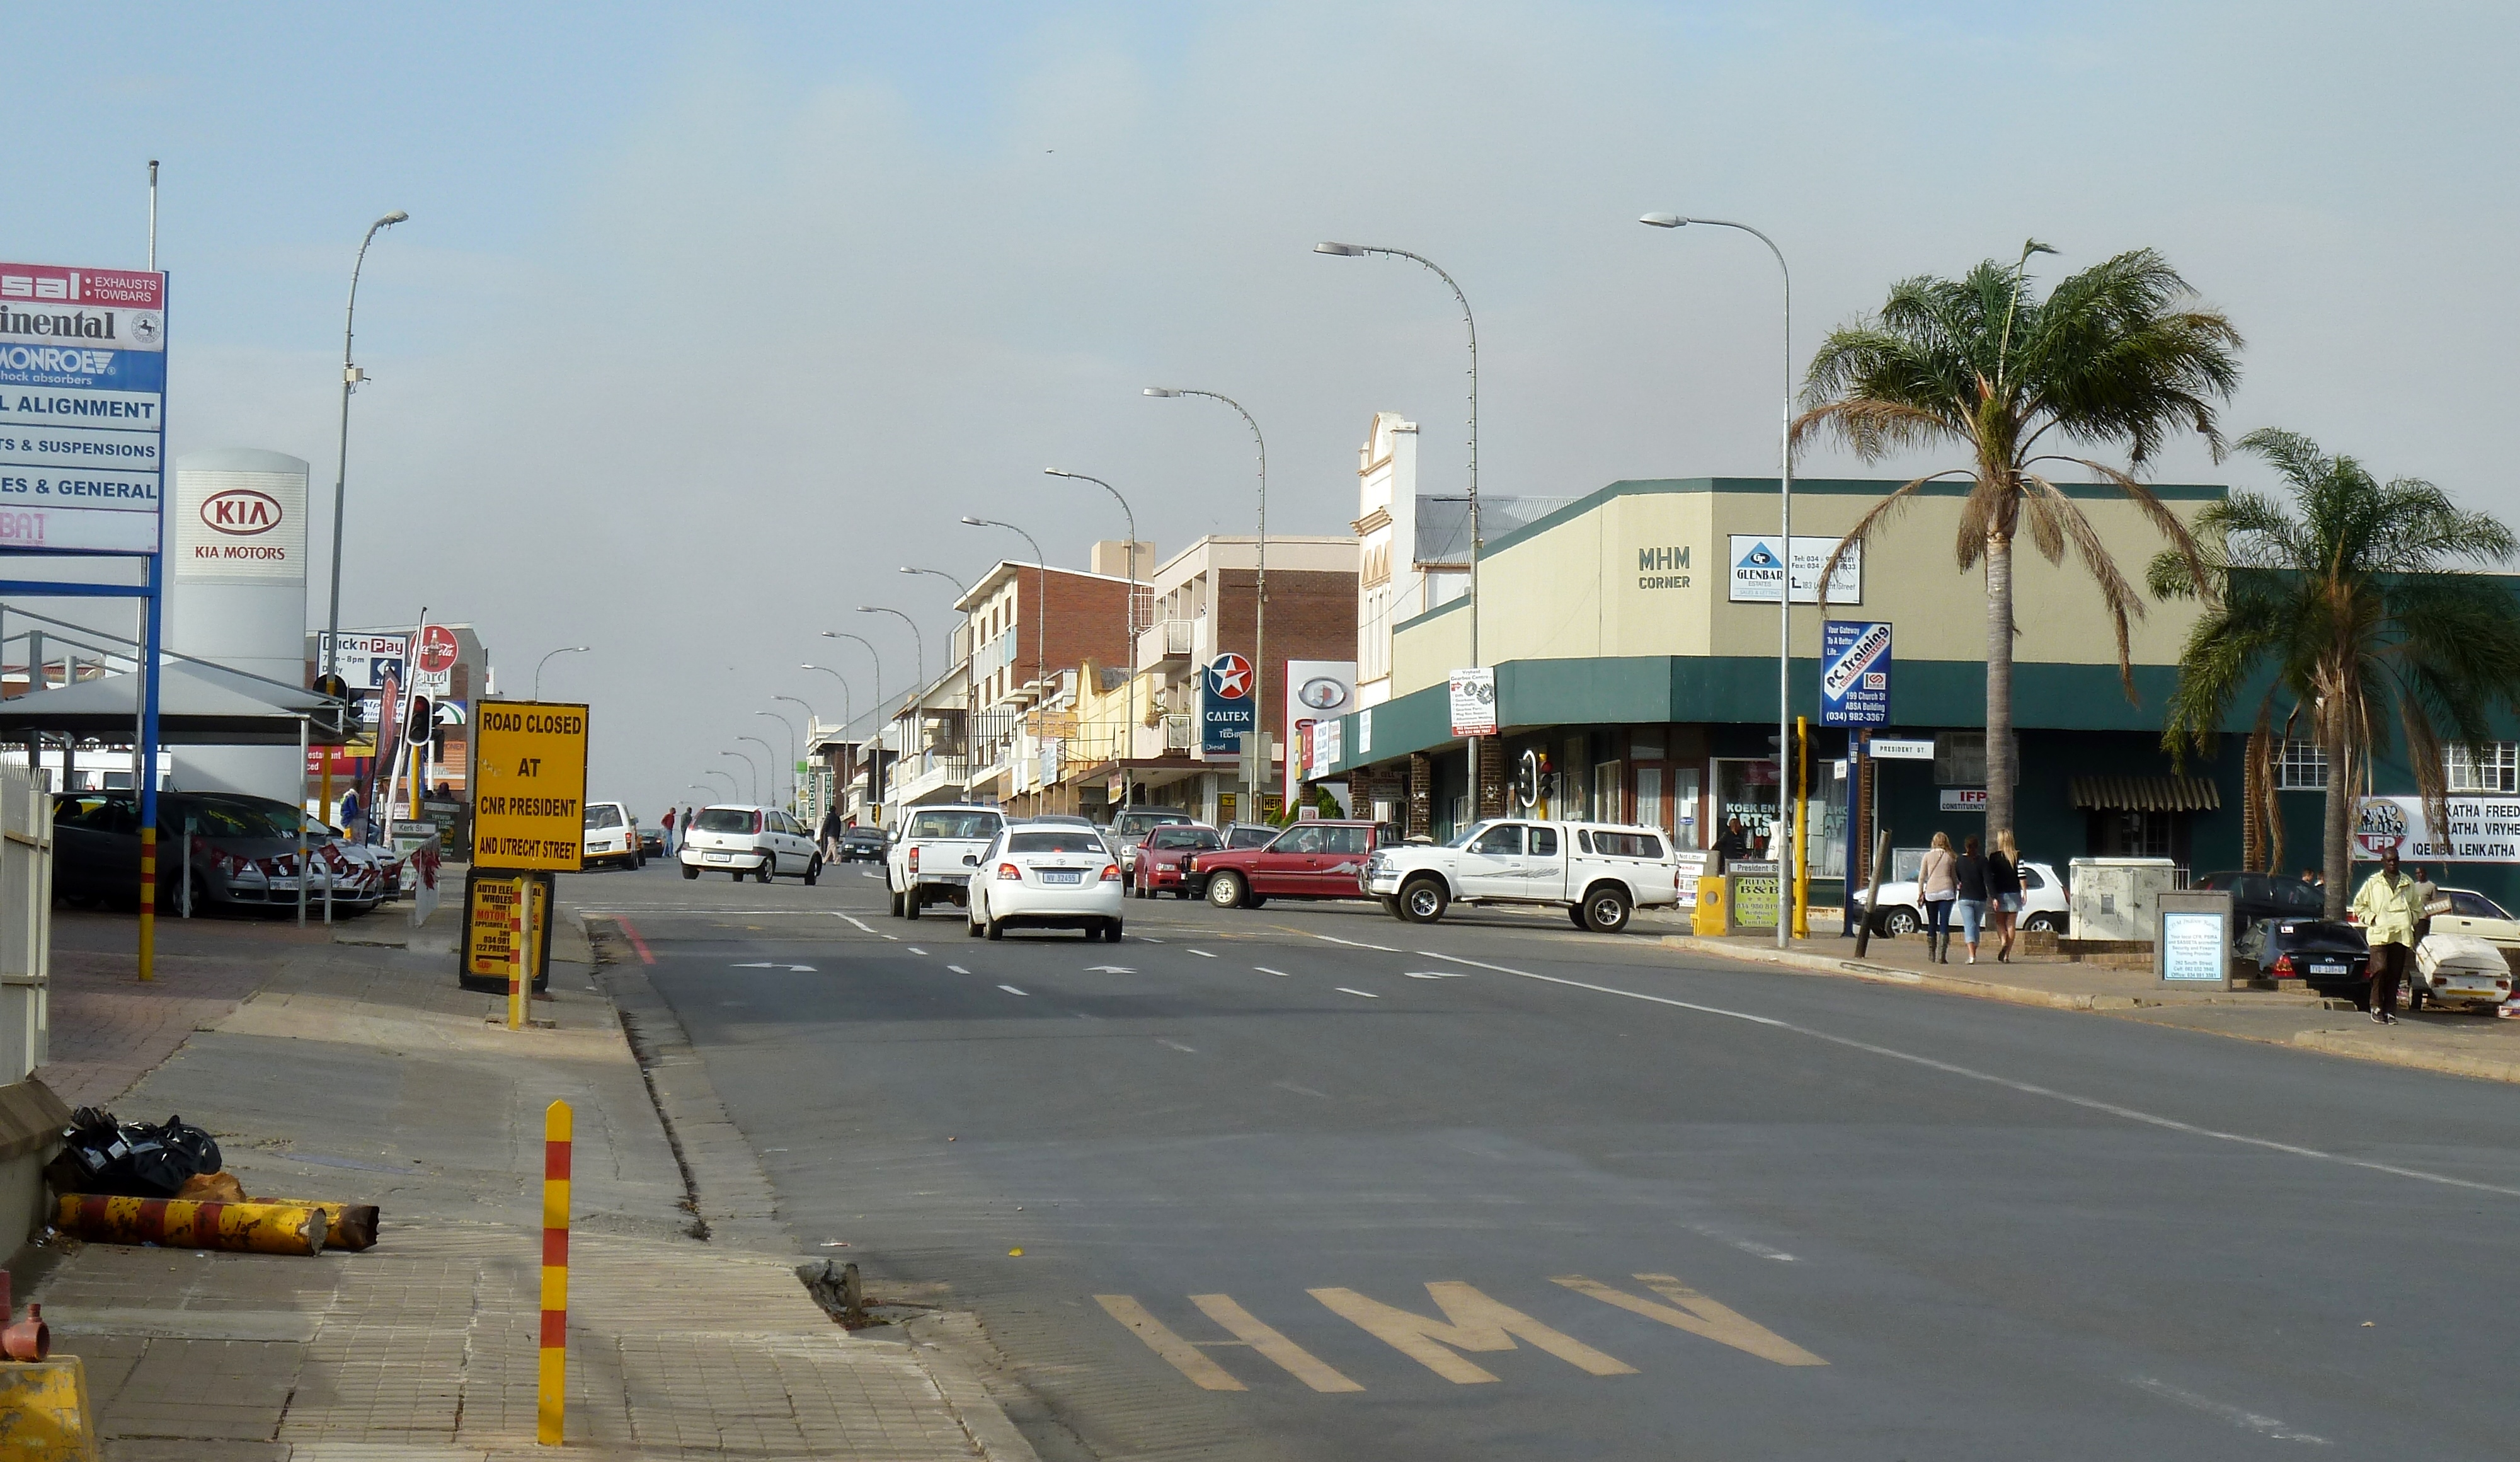
Durnacol
Durnacol is a small suburban town in the central part of KwaZulu-Natal, South Africa. The name is an acronym for Durban Navigational Collieries, a mine that was opened at the turn of the 20th century. The mine mainly produced coking coal for the ship..
Durnacol Wikipedia Page


About Our Data
The data on this page is estimated using a number of publicly available tools and resources. It is provided without warranty, and could contain inaccuracies. Use at your own risk.