Categories in Hazyview
Industries
Business Distribution by Industry in Hazyview
| Industry Description | Number of Establishments | Average Google Rating |
|---|---|---|
| Shopping | 84 | 4 |
| Other accommodation | 71 | 4.3 |
| Hotels and motels | 36 | 4.3 |
| Holiday homes, cabins and resorts | 26 | 4.3 |
| Clothing stores | 23 | 3 |
| Department stores | 19 | 3.7 |
| Travel agencies | 18 | 4.4 |
| Restaurants | 15 | 4.2 |
| All food and beverage | 15 | 4.1 |
| Bed and breakfasts | 12 | 4.4 |
| Grocery stores and supermarkets | 12 | 4 |
| Gas station | 11 | 3.8 |
| Loan companies | 8 | — |
| Car repair | 8 | 4 |
| Tour operators | 8 | 4 |
| Sports and recreation | 7 | 4.5 |
| Household appliances and goods | 7 | 3.7 |
| Atm's | 7 | — |
| Furniture stores | 6 | 3 |
| Pharmacies and drug stores | 6 | 4.2 |
| Health and medical | 6 | — |
| General contractors | 6 | 3 |
| Shopping other | 5 | 5 |
| Hospitals | 5 | — |
| African restaurants | 5 | 4.1 |
Hazyview Facts
| Area | 0.8 km² |
| Population | 1,165 |
| Male Population | 585 (50.2%) |
| Female Population | 580 (49.8%) |
| Population change (1975 to 2020) | +164.8% |
| Population change (2000 to 2020) | +39.9% |
| Median Age | 35.3 years (Male: 34.9, Female: 35.7) |
| Neighborhoods | Hazyview, Hazyview-Vakansiedorp, Numbipark, Kiepersol, Hazyview Ext 6 |
| Local Time | |
| Timezone | South Africa Standard Time |
| Lat & Lng | -25.04398, 31.12767 |
| Postal Codes | 1242, 1249 |
Map of Hazyview
Interactive Map
Hazyview Population
Years 1975 to 2020
| Data | 1975 | 1990 | 2000 | 2015 | 2020 |
|---|---|---|---|---|---|
| Population | 440 | 729 | 833 | 1,130 | 1,165 |
| Population Density | 586.7 / km² | 972 / km² | 1,110.7 / km² | 1,506.7 / km² | 1,553.3 / km² |
Hazyview Population change from 2000 to 2015
Increase of 35.7% from year 2000 to 2015
| Location | Change since 1975 | Change since 1990 | Change since 2000 |
|---|---|---|---|
| Hazyview | +156.8% | +55% | +35.7% |
| Mpumalanga | +151.2% | +62.9% | +28% |
| South Africa | +111.9% | +48.1% | +21.4% |
Hazyview Median Age
Median Age: 35.3 years
| Location | Median Age | Median Age (Female) | Median Age (Male) |
|---|---|---|---|
| Hazyview | 35.3 yrs | 35.7 yrs | 34.9 yrs |
| Mpumalanga | 23.9 yrs | 24.6 yrs | 23.2 yrs |
| South Africa | 25.4 yrs | 26.3 yrs | 24.5 yrs |
Hazyview Population Density
Population Density: 1,553 / km²
| Location | Population | Area | Density |
|---|---|---|---|
| Hazyview | 1,165 | 0.75 km² | 1,553 / km² |
| Mpumalanga | 4.3 million | 76,494.7 km² | 56.2 / km² |
| South Africa | 54.3 million | 1,219,846.5 km² | 44.5 / km² |
Hazyview Historical and Projected Population
Estimated Population from 1880 to 2100
- JRC (European Commission's Joint Research Centre) work on the GHS built-up grid
- CIESIN (Center for International Earth Science Information Network)
- [Link] Klein Goldewijk, K., Beusen, A., Doelman, J., and Stehfest, E.: Anthropogenic land use estimates for the Holocene – HYDE 3.2, Earth Syst. Sci. Data, 9, 927–953, https://doi.org/10.5194/essd-9-927-2017, 2017.
Neighborhoods in Hazyview
Percentage of businesses by neighborhood in Hazyview
Area Codes
Percentage Area Codes used by businesses in Hazyview
Price Distribution
Business distribution by price for Hazyview
Human Development Index (HDI)
Statistic composite index of life expectancy, education, and per capita income.
Hazyview CO2 Emissions
Carbon Dioxide (CO2) Emissions Per Capita in Tonnes Per Year
| Location | CO2 Emissions | CO2 Emissions Per Capita | CO2 Emissions Intensity |
|---|---|---|---|
| Hazyview | 7,881 tn | 6.76 tn | 10,507.4 tons/km² |
| Mpumalanga | 29,616,574 tn | 6.89 tn | 387.2 tons/km² |
| South Africa | 358,473,408 tn | 6.6 tn | 293.9 tons/km² |
| 2013 CO2 emissions (tonnes/year) | 7,881 tn |
| 2013 CO2 emissions (tonnes/year) per capita | 6.76 tn |
| 2013 CO2 emissions intensity (tonnes/km²/year) | 10,507.4 tons/km² |
Natural Hazards Risk
Relative risk out of 10
| Hazard | Risk Level |
|---|---|
| Drought | High (9) |
| Flood | Medium (7) |
* Risk, particularly concerning flood or landslide, may not be for the entire area.
- Dilley, M., R.S. Chen, U. Deichmann, A.L. Lerner-Lam, M. Arnold, J. Agwe, P. Buys, O. Kjekstad, B. Lyon, and G. Yetman. 2005. Natural Disaster Hotspots: A Global Risk Analysis. Washington, D.C.: World Bank. https://doi.org/10.1596/0-8213-5930-4.
- Center for Hazards and Risk Research - CHRR - Columbia University, Center for International Earth Science Information Network - CIESIN - Columbia University, and International Research Institute for Climate and Society - IRI - Columbia University. 2005. Global Drought Hazard Frequency and Distribution. Palisades, NY: NASA Socioeconomic Data and Applications Center (SEDAC). https://doi.org/10.7927/H4VX0DFT.
- Center for Hazards and Risk Research - CHRR - Columbia University, Center for International Earth Science Information Network - CIESIN - Columbia University. 2005. Global Flood Hazard Frequency and Distribution. Palisades, NY: NASA Socioeconomic Data and Applications Center (SEDAC). https://doi.org/10.7927/H4668B3D.
Recent Nearby Earthquakes
Magnitude 3.0 and greater
| Date▼ | Time↕ | Magnitude↕ | Distance↕ | Depth↕ | Location↕ | Link |
|---|---|---|---|---|---|---|
| 7/7/13 | 2:52 PM | 4.6 | 86.2 km | 5,000 m | 50km W of Barberton, South Africa | usgs.gov |
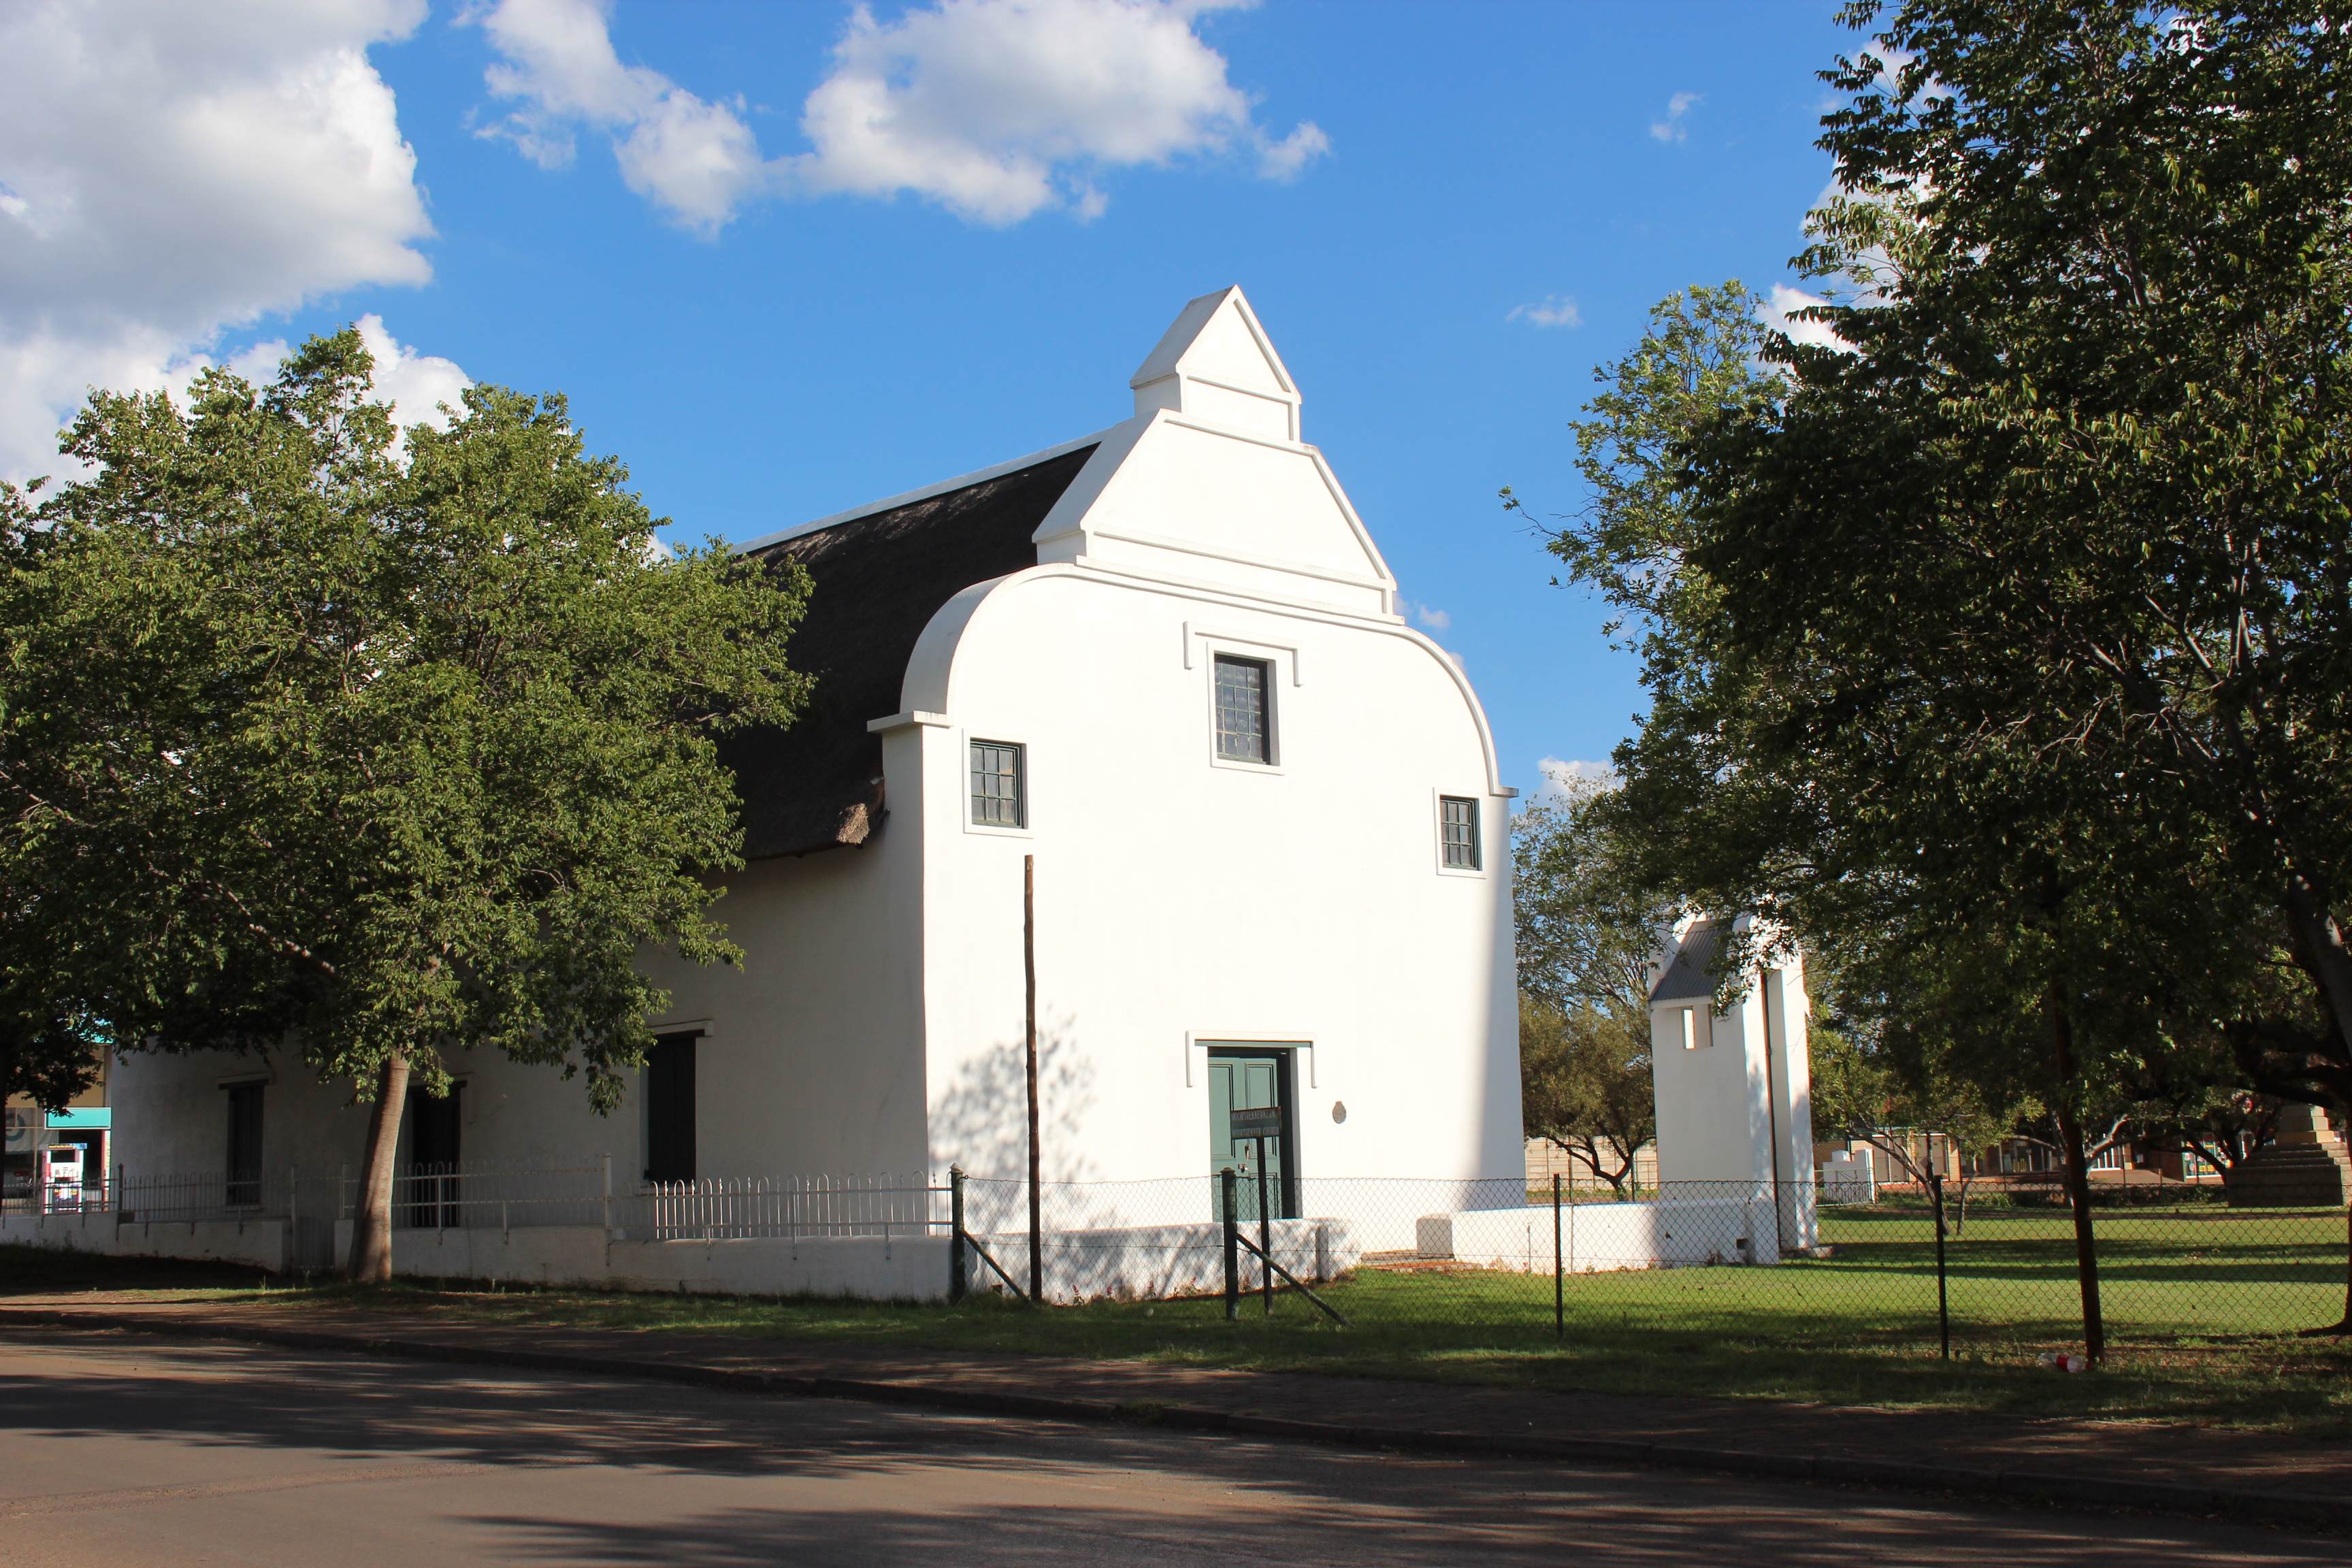
Hazyview
Hazyview is a small farming town in Mpumalanga, South Africa and is renowned for its banana industry. Close to Kruger National Park, the town's name is derived from the shimmering haze that occurs during the heat of summer. Most of Mpumalanga's priva..
Hazyview Wikipedia Page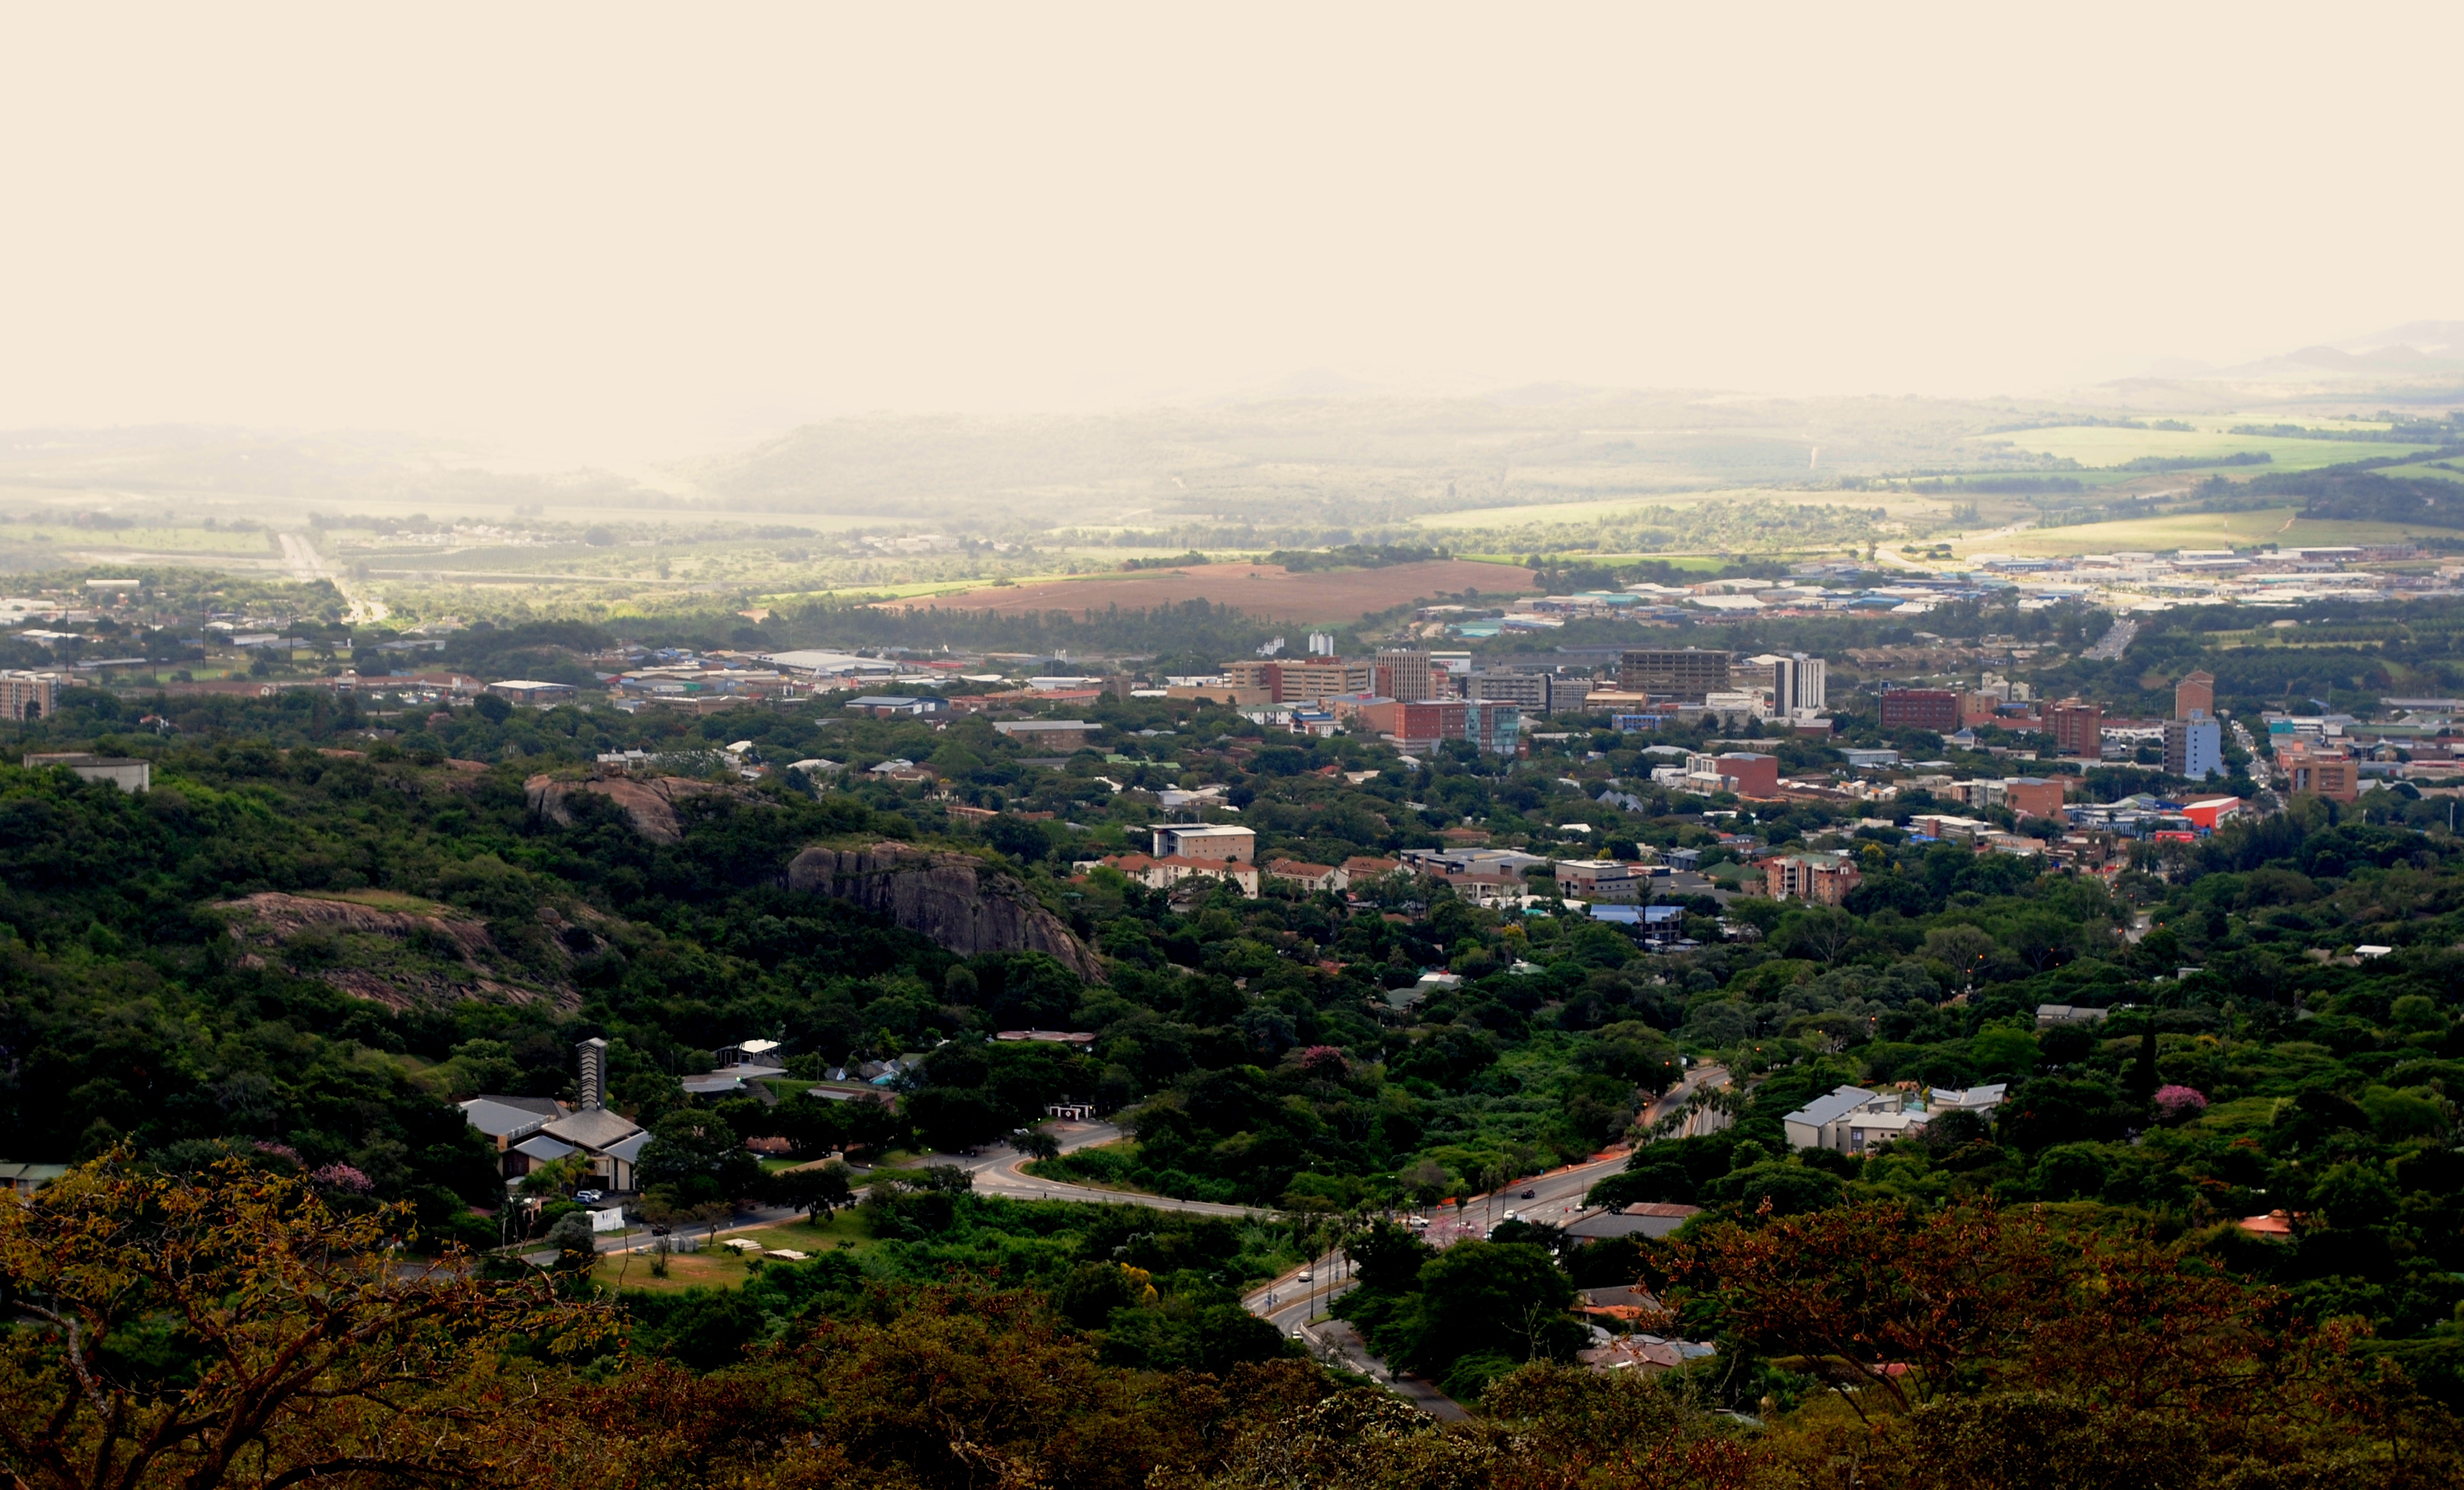

About Our Data
The data on this page is estimated using a number of publicly available tools and resources. It is provided without warranty, and could contain inaccuracies. Use at your own risk.