Businesses in Hendrina
Hotels & Travel
Restaurants
Automotive
Financial Services
Medical
Beauty & Spas
Community & Government
Industries
Business Distribution by Industry Shopping: 22.3%
Food: 13%
Industry: 9.3%
Automotive: 7.6%
Restaurants: 5.7%
Religion: 5.5%
Professional Services: 5.5%
Hotels & Travel: 5.1%
Education: 4.9%
Other: 21.2%
| Industry Description | Number of Establishments | Average Google Rating | Businesses per 1,000 residents |
|---|---|---|---|
| Beauty salons | 8 | 5.0 | 30.5 |
| Hairdressers | 7 | 5.0 | 26.7 |
| Grocery stores and supermarkets | 14 | 3.7 | 53.4 |
| Area of Hendrina, Mpumalanga | 2.158 km² |
| Population | 262 |
| Male Population | 142 (54%) |
| Female Population | 120 (46%) |
| Population change from 1975 to 2015 | +835.7% |
| Population change from 2000 to 2015 | +98.5% |
| Median Age | 35.2 |
| Male Median Age | 34.7 |
| Female Median Age | 35.8 |
| Neighborhoods | Hendrina, Kwazamokuhle |
| Local Time | Thursday 2:35 PM |
| Timezone | South Africa Standard Time |
| Lat & Lng | -26.15881° / 29.71528° |
| Postal Codes | 1095, 1098 |
Hendrina, Mpumalanga - Map
Hendrina, Mpumalanga Population
Years 1975 to 2015| Data | 1975 | 1990 | 2000 | 2015 |
|---|---|---|---|---|
| Population | 28 | 70 | 132 | 262 |
| Population Density | 13.0 / km² | 32.4 / km² | 61.2 / km² | 121.4 / km² |
Hendrina Population change from 2000 to 2015
Increase of 98.5% from year 2000 to 2015| Location | Change since 1975 | Change since 1990 | Change since 2000 |
|---|---|---|---|
| Hendrina, Mpumalanga | +835.7% | +274.3% | +98.5% |
| Mpumalanga | +151.2% | +62.9% | +28% |
| South Africa | +111.9% | +48.1% | +21.4% |
Hendrina, Mpumalanga Median Age
Median Age: 35.2 years| Location | Median Age | Median Age (Female) | Median Age (Male) |
|---|---|---|---|
| Hendrina, Mpumalanga | 35.2 years | 35.8 years | 34.7 years |
| Mpumalanga | 23.9 years | 24.6 years | 23.2 years |
| South Africa | 25.4 years | 26.3 years | 24.5 years |
Hendrina, Mpumalanga Population Tree
Population By Age and Gender| Age | Male | Female | Total |
|---|---|---|---|
| Under 5 | 10 | 7 | 17 |
| 5-9 | 5 | 5 | 11 |
| 10-14 | 8 | 9 | 18 |
| 15-19 | 8 | 10 | 19 |
| 20-24 | 17 | 13 | 31 |
| 25-29 | 12 | 10 | 22 |
| 30-34 | 11 | 4 | 16 |
| 35-39 | 10 | 10 | 20 |
| 40-44 | 8 | 12 | 21 |
| 45-49 | 12 | 8 | 20 |
| 50-54 | 11 | 6 | 18 |
| 55-59 | 8 | 7 | 15 |
| 60-64 | 9 | 5 | 14 |
| 65-69 | 5 | 5 | 10 |
| 70-74 | 3 | 3 | 6 |
| 75-79 | 2 | 3 | 5 |
| 80-84 | 2 | 2 | 4 |
| 85 Plus | 1 | 1 | 3 |
Hendrina, Mpumalanga Population Density
Population Density: 121.4 / km²| Location | Population | Area | Population Density |
|---|---|---|---|
| Hendrina, Mpumalanga | 262 | 2.158 km² | 121.4 / km² |
| Mpumalanga | 4.3 million | 76,494.7 km² | 56.2 / km² |
| South Africa | 54.3 million | 1,219,846.5 km² | 44.5 / km² |
Hendrina, Mpumalanga Historical and Projected Population
Estimated Population from 1890 to 2100Sources:
1. JRC (European Commission's Joint Research Centre) work on the GHS built-up grid
2. CIESIN (Center for International Earth Science Information Network)
3. [Link] Klein Goldewijk, K., Beusen, A., Doelman, J., and Stehfest, E.: Anthropogenic land use estimates for the Holocene – HYDE 3.2, Earth Syst. Sci. Data, 9, 927–953, https://doi.org/10.5194/essd-9-927-2017, 2017.
Area Codes
Percentage Area Codes used by businesses in Hendrina Area Code 13: 77.3%
Area Code 7: 13.6%
Area Code 82: 4.5%
Other: 4.5%
Human Development Index (HDI)
Statistic composite index of life expectancy, education, and per capita income.Sources: [Link] Kummu, M., Taka, M. & Guillaume, J. Gridded global datasets for Gross Domestic Product and Human Development Index over 1990–2015. Sci Data 5, 180004 (2018) doi:10.1038/sdata.2018.4
Hendrina, Mpumalanga CO2 Emissions
Carbon Dioxide (CO2) Emissions Per Capita in Tonnes Per Year| Location | CO2 Emissions | CO2 Emissions Per Capita | CO2 Emissions Intensity |
|---|---|---|---|
| Hendrina, Mpumalanga | 1,958 tn | 7.47 tn | 907.3 tons/km² |
| Mpumalanga | 29,616,574 tn | 6.89 tn | 387.2 tons/km² |
| South Africa | 358,473,407 tn | 6.6 tn | 293.9 tons/km² |
Hendrina, Mpumalanga CO2 Emissions
| 2013 CO2 emissions (tonnes/year) | 1,958 tn |
| 2013 CO2 emissions (tonnes/year) per capita | 7.47 tn |
| 2013 CO2 emissions intensity (tonnes/km²/year) | 907.3 tons/km² |
Natural Hazards Risk
Relative risk out of 10| Drought | Medium (5) |
* Risk, particularly concerning flood or landslide, may not be for the entire area.
Sources: 1. Dilley, M., R.S. Chen, U. Deichmann, A.L. Lerner-Lam, M. Arnold, J. Agwe, P. Buys, O. Kjekstad, B. Lyon, and G. Yetman. 2005. Natural Disaster Hotspots: A Global Risk Analysis. Washington, D.C.: World Bank. https://doi.org/10.1596/0-8213-5930-4.
2. Center for Hazards and Risk Research - CHRR - Columbia University, Center for International Earth Science Information Network - CIESIN - Columbia University, and International Research Institute for Climate and Society - IRI - Columbia University. 2005. Global Drought Hazard Frequency and Distribution. Palisades, NY: NASA Socioeconomic Data and Applications Center (SEDAC). https://doi.org/10.7927/H4VX0DFT.
Recent Nearby Earthquakes
Magnitude 3.0 and greater| Date | Time | Magnitude | Distance | Depth | Location | Link |
|---|---|---|---|---|---|---|
| 7/1/19 | 1:28 AM | 3.7 | 98.1 km | 5,000 m | 36km W of Mhlambanyatsi, Swaziland | usgs.gov |
| 11/25/18 | 3:47 PM | 4.6 | 79.7 km | 5,000 m | 6km WNW of eMbalenhle, South Africa | usgs.gov |
| 7/18/18 | 6:34 PM | 4.3 | 46.4 km | 5,000 m | 32km NNE of Breyten, South Africa | usgs.gov |
| 5/30/08 | 7:00 AM | 3.6 | 44.8 km | 5,000 m | South Africa | usgs.gov |
| 7/11/02 | 8:16 PM | 4.7 | 75.4 km | 5,000 m | South Africa | usgs.gov |
| 3/19/93 | 5:39 AM | 3.3 | 44.7 km | 5,000 m | South Africa | usgs.gov |
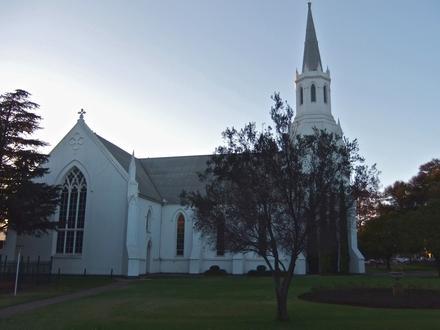
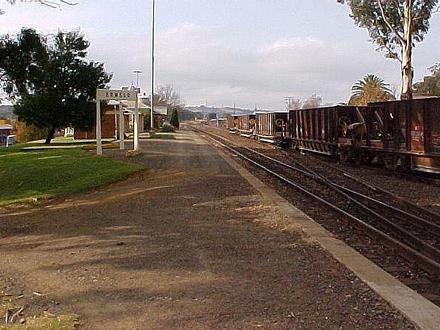
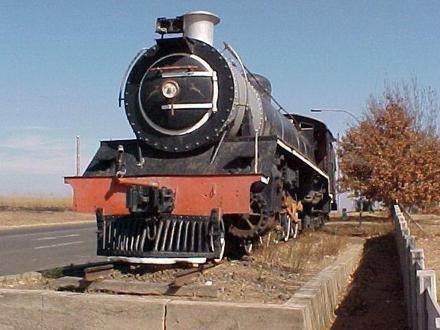
Hendrina, Mpumalanga
Hendrina is a settlement in Nkangala District Municipality in the Mpumalanga province of South Africa. 53km north-west of Ermelo, 40km west-south-west of Carolina and 53km south-east of Middelburg. It was founded in 1914 on the farm Grasfontein, adm.. Hendrina Wikipedia Page
Postal Codes
Percentage of businesses by Postal Codes in Hendrina Postal Code 1095: 89.5%
Postal Code 1098: 8.6%
Other: 1.9%
About Our Data
The data on this page is estimated using a number of publicly available tools and resources. It is provided without warranty, and could contain inaccuracies. Use at your own risk. See here for more information.