Categories in Jacobsdal
Industries
Business Distribution by Industry in Jacobsdal
| Industry Description | Number of Establishments |
|---|---|
| Grocery stores and supermarkets | 9 |
Jacobsdal Facts
| Area | 0.9 km² |
| Population | 269 |
| Male Population | 134 (49.8%) |
| Female Population | 135 (50.2%) |
| Population change (1975 to 2020) | -38.7% |
| Population change (2000 to 2020) | -30.3% |
| Median Age | 24.3 years (Male: 23.5, Female: 25.6) |
| Neighborhoods | Jacobsdal, Ratanang |
| Local Time | |
| Timezone | South Africa Standard Time |
| Lat & Lng | -29.12792, 24.77382 |
| Postal Codes | 8710 |
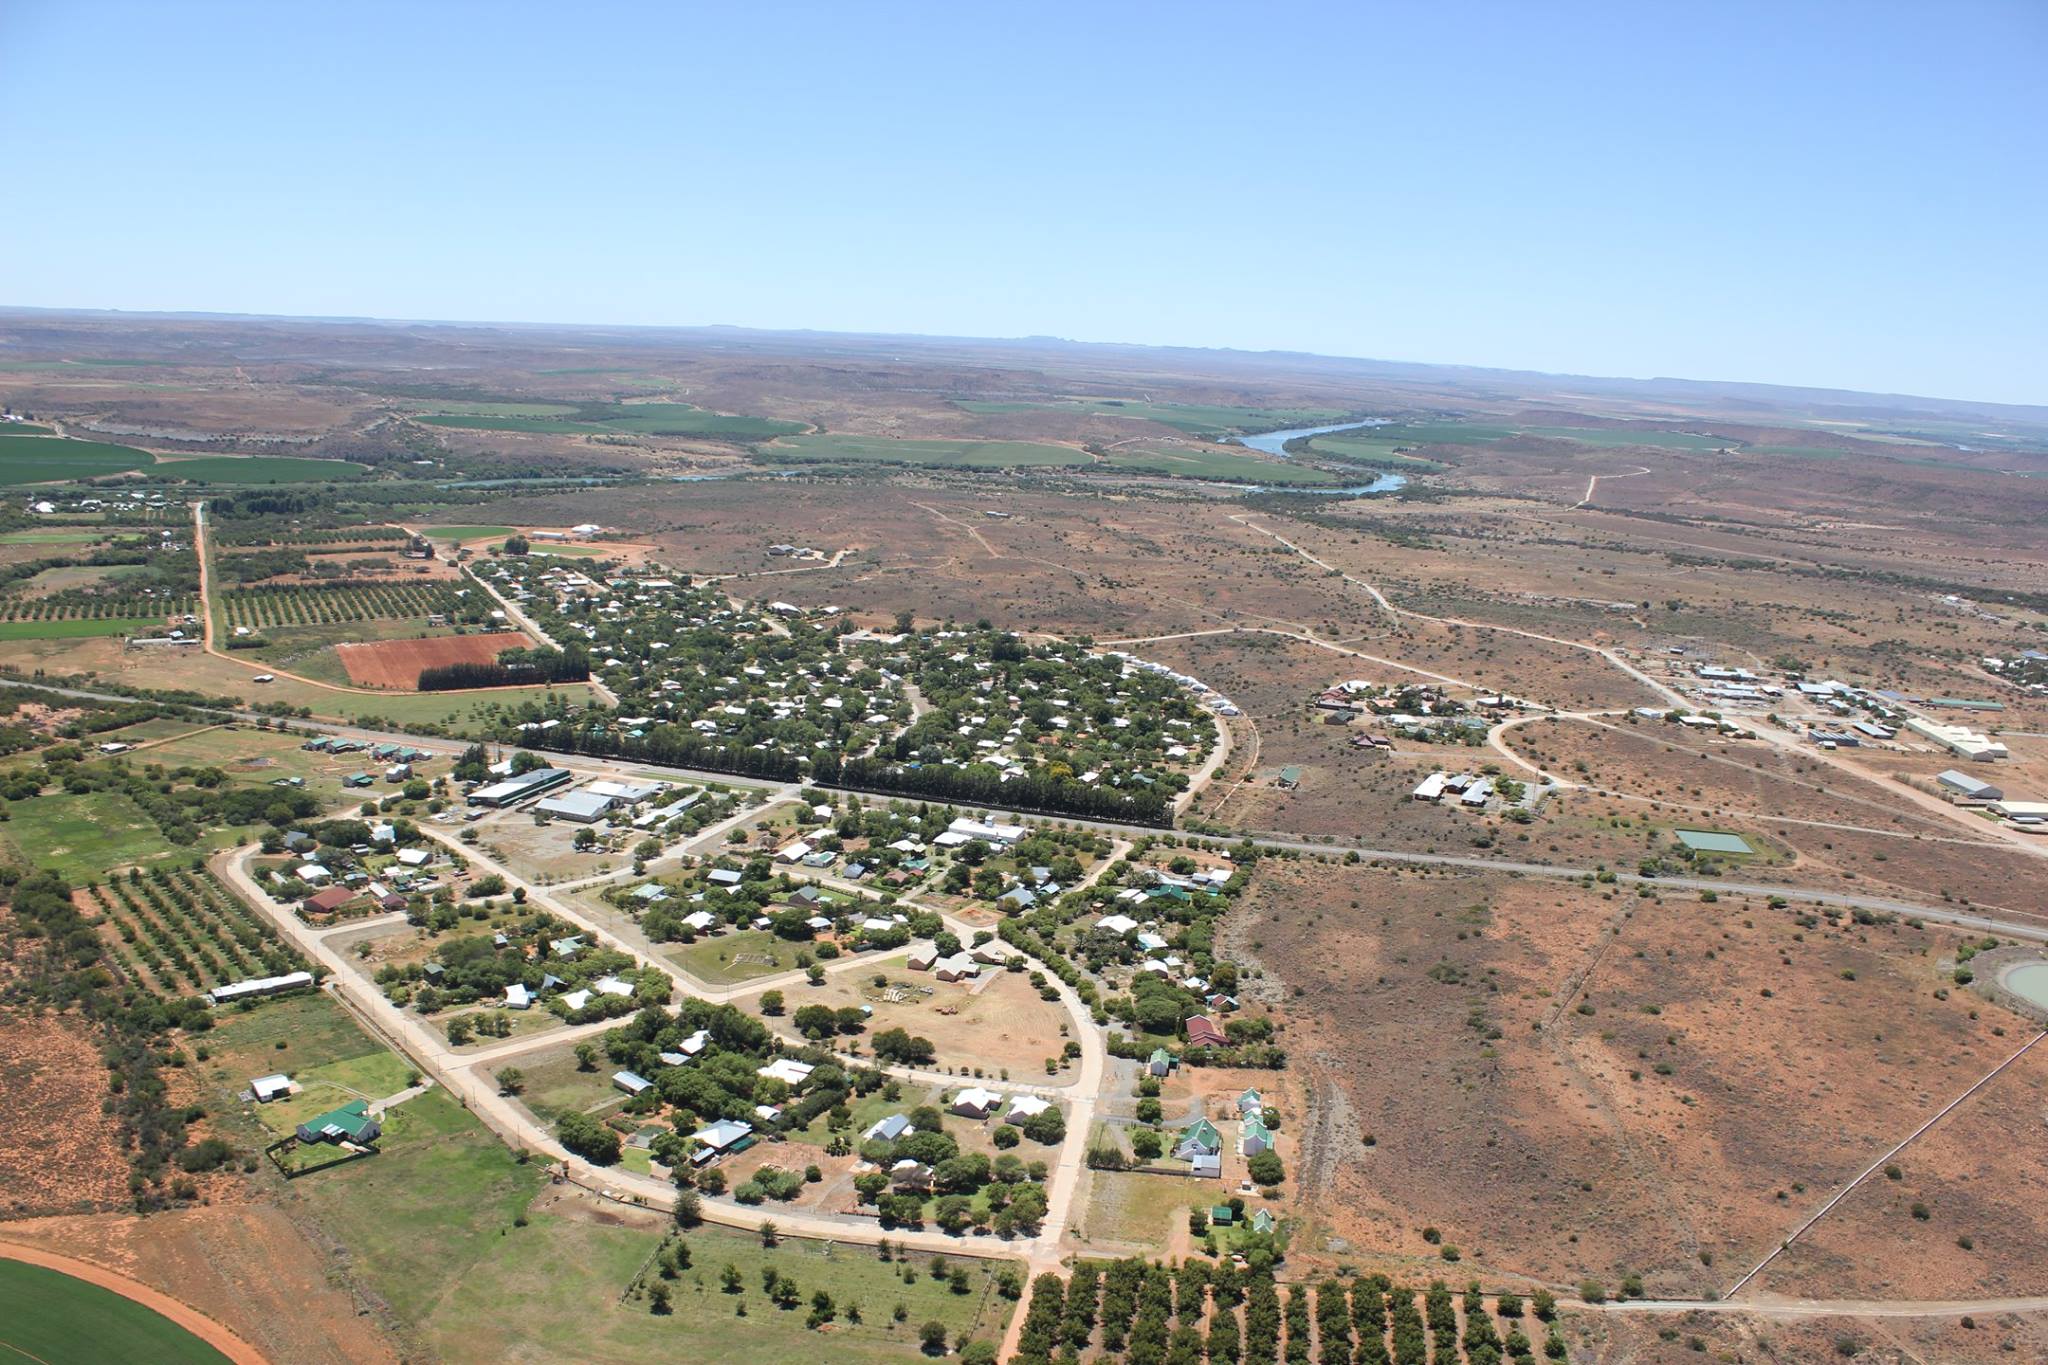
Map of Jacobsdal
Interactive Map
Jacobsdal Population
Years 1975 to 2030
| Data | 1975 | 1990 | 2000 | 2015 | 2020 | 2025* | 2030* |
|---|---|---|---|---|---|---|---|
| Population | 439 | 405 | 386 | 314 | 269 | 245 | 227 |
| Population Density | 468.3 / km² | 432 / km² | 411.7 / km² | 334.9 / km² | 286.9 / km² | 261.3 / km² | 242.1 / km² |
Jacobsdal Population change from 2000 to 2020
Decrease of 30.3% from year 2000 to 2020
| Location | Change since 1975 | Change since 1990 | Change since 2000 |
|---|---|---|---|
| Jacobsdal | -38.7% | -33.6% | -30.3% |
| Free State (province) | — | — | — |
| South Africa | — | — | — |
Jacobsdal Median Age
Median Age: 24.3 years
| Location | Median Age | Median Age (Female) | Median Age (Male) |
|---|---|---|---|
| Jacobsdal | 24.3 yrs | 25.6 yrs | 23.5 yrs |
| Free State (province) | 25.6 yrs | 26.6 yrs | 24.6 yrs |
| South Africa | 25.4 yrs | 26.3 yrs | 24.5 yrs |
Jacobsdal Population Density
Population Density: 287 / km²
| Location | Population | Area | Density |
|---|---|---|---|
| Jacobsdal | 269 | 0.938 km² | 287 / km² |
| Free State (province) | 2.7 million | 129,825.2 km² | 21.2 / km² |
| South Africa | 54.3 million | 1,219,846.5 km² | 44.5 / km² |
Jacobsdal Historical and Projected Population
Estimated Population from 1300 to 2100
- JRC (European Commission's Joint Research Centre) work on the GHS built-up grid
- CIESIN (Center for International Earth Science Information Network)
- [Link] Klein Goldewijk, K., Beusen, A., Doelman, J., and Stehfest, E.: Anthropogenic land use estimates for the Holocene – HYDE 3.2, Earth Syst. Sci. Data, 9, 927–953, https://doi.org/10.5194/essd-9-927-2017, 2017.
Area Codes
Percentage Area Codes used by businesses in Jacobsdal
Human Development Index (HDI)
Statistic composite index of life expectancy, education, and per capita income.
Jacobsdal CO2 Emissions
Carbon Dioxide (CO2) Emissions Per Capita in Tonnes Per Year
| Location | CO2 Emissions | CO2 Emissions Per Capita | CO2 Emissions Intensity |
|---|---|---|---|
| Jacobsdal | 1,647 tn | 6.12 tn | 1,757.3 tons/km² |
| Free State (province) | 17,793,024 tn | 6.47 tn | 137.1 tons/km² |
| South Africa | 358,473,408 tn | 6.6 tn | 293.9 tons/km² |
| 2013 CO2 emissions (tonnes/year) | 1,647 tn |
| 2013 CO2 emissions (tonnes/year) per capita | 6.12 tn |
| 2013 CO2 emissions intensity (tonnes/km²/year) | 1,757.3 tons/km² |
Natural Hazards Risk
Relative risk out of 10
| Hazard | Risk Level |
|---|---|
| Drought | High (9) |
| Earthquake | Low (2) |
* Risk, particularly concerning flood or landslide, may not be for the entire area.
- Dilley, M., R.S. Chen, U. Deichmann, A.L. Lerner-Lam, M. Arnold, J. Agwe, P. Buys, O. Kjekstad, B. Lyon, and G. Yetman. 2005. Natural Disaster Hotspots: A Global Risk Analysis. Washington, D.C.: World Bank. https://doi.org/10.1596/0-8213-5930-4.
- Center for Hazards and Risk Research - CHRR - Columbia University, Center for International Earth Science Information Network - CIESIN - Columbia University, and International Research Institute for Climate and Society - IRI - Columbia University. 2005. Global Drought Hazard Frequency and Distribution. Palisades, NY: NASA Socioeconomic Data and Applications Center (SEDAC). https://doi.org/10.7927/H4VX0DFT.
- Center for Hazards and Risk Research - CHRR - Columbia University, Center for International Earth Science Information Network - CIESIN - Columbia University. 2005. Global Earthquake Hazard Distribution - Peak Ground Acceleration. Palisades, NY: NASA Socioeconomic Data and Applications Center (SEDAC). https://doi.org/10.7927/H4BZ63ZS.
Recent Nearby Earthquakes
Magnitude 3.0 and greater
| Date▼ | Time↕ | Magnitude↕ | Distance↕ | Depth↕ | Location↕ | Link |
|---|---|---|---|---|---|---|
| 10/1/15 | 8:15 PM | 4.4 | 37.8 km | 5,000 m | 45km S of Ritchie, South Africa | usgs.gov |
| 1/8/02 | 5:32 AM | 4.7 | 66.2 km | 5,000 m | South Africa | usgs.gov |
| 1/8/02 | 5:32 AM | 4.1 | 61.5 km | 5,000 m | South Africa | usgs.gov |
| 7/3/99 | 8:53 PM | 4.5 | 32.2 km | 5,000 m | South Africa | usgs.gov |
| 5/8/85 | 11:35 AM | 4.8 | 30.9 km | 5,000 m | South Africa | usgs.gov |
| 9/5/83 | 12:33 AM | 4.7 | 10.7 km | 5,000 m | South Africa | usgs.gov |
| 7/1/76 | 11:24 AM | 5.9 | 59 km | 33,000 m | South Africa | usgs.gov |
| 6/8/75 | 6:32 PM | 4.4 | 42.7 km | 33,000 m | South Africa | usgs.gov |
Jacobsdal
Jacobsdal is a small farming town in the Free State province of South Africa with various crops under irrigation, such as grapes, potatoes, lucerne and groundnuts. The town was layout in 1859 by Christoffel Jacobs on his farm Kalkfontein, and today h..
Jacobsdal Wikipedia Page

About Our Data
The data on this page is estimated using a number of publicly available tools and resources. It is provided without warranty, and could contain inaccuracies. Use at your own risk.