Categories in Luckhoff
Luckhoff Facts
| Area | 0.6 km² |
| Population | 2,640 |
| Male Population | 1,267 (48.0%) |
| Female Population | 1,373 (52.0%) |
| Population change (1975 to 2020) | +134.9% |
| Population change (2000 to 2020) | +404.8% |
| Median Age | 21.9 years (Male: 20.5, Female: 23.4) |
| Neighborhoods | Luckhof |
| Local Time | |
| Timezone | South Africa Standard Time |
| Lat & Lng | -29.75023, 24.78794 |
| Postal Codes | 9982 |
Map of Luckhoff
Interactive Map
Luckhoff Population
Years 1975 to 2030
| Data | 1975 | 1990 | 2000 | 2015 | 2020 | 2025* | 2030* |
|---|---|---|---|---|---|---|---|
| Population | 1,124 | 863 | 523 | 435 | 2,640 | 2,458 | 2,311 |
| Population Density | 1,798.4 / km² | 1,380.8 / km² | 836.8 / km² | 696 / km² | 4,224 / km² | 3,932.8 / km² | 3,697.6 / km² |
Luckhoff Population change from 2000 to 2020
Increase of 404.8% from year 2000 to 2020
| Location | Change since 1975 | Change since 1990 | Change since 2000 |
|---|---|---|---|
| Luckhoff | +134.9% | +205.9% | +404.8% |
| Free State (province) | — | — | — |
| South Africa | — | — | — |
Luckhoff Median Age
Median Age: 21.9 years
| Location | Median Age | Median Age (Female) | Median Age (Male) |
|---|---|---|---|
| Luckhoff | 21.9 yrs | 23.4 yrs | 20.5 yrs |
| Free State (province) | 25.6 yrs | 26.6 yrs | 24.6 yrs |
| South Africa | 25.4 yrs | 26.3 yrs | 24.5 yrs |
Luckhoff Population Density
Population Density: 4,224 / km²
| Location | Population | Area | Density |
|---|---|---|---|
| Luckhoff | 2,640 | 0.625 km² | 4,224 / km² |
| Free State (province) | 2.7 million | 129,825.2 km² | 21.2 / km² |
| South Africa | 54.3 million | 1,219,846.5 km² | 44.5 / km² |
Luckhoff Historical and Projected Population
Estimated Population from 1000 to 2100
- JRC (European Commission's Joint Research Centre) work on the GHS built-up grid
- CIESIN (Center for International Earth Science Information Network)
- [Link] Klein Goldewijk, K., Beusen, A., Doelman, J., and Stehfest, E.: Anthropogenic land use estimates for the Holocene – HYDE 3.2, Earth Syst. Sci. Data, 9, 927–953, https://doi.org/10.5194/essd-9-927-2017, 2017.
Human Development Index (HDI)
Statistic composite index of life expectancy, education, and per capita income.
Luckhoff CO2 Emissions
Carbon Dioxide (CO2) Emissions Per Capita in Tonnes Per Year
| Location | CO2 Emissions | CO2 Emissions Per Capita | CO2 Emissions Intensity |
|---|---|---|---|
| Luckhoff | 16,168 tn | 6.12 tn | 25,869.4 tons/km² |
| Free State (province) | 17,793,024 tn | 6.47 tn | 137.1 tons/km² |
| South Africa | 358,473,408 tn | 6.6 tn | 293.9 tons/km² |
| 2013 CO2 emissions (tonnes/year) | 16,168 tn |
| 2013 CO2 emissions (tonnes/year) per capita | 6.12 tn |
| 2013 CO2 emissions intensity (tonnes/km²/year) | 25,869.4 tons/km² |
Natural Hazards Risk
Relative risk out of 10
| Hazard | Risk Level |
|---|---|
| Drought | High (9) |
| Earthquake | Low (2) |
* Risk, particularly concerning flood or landslide, may not be for the entire area.
- Dilley, M., R.S. Chen, U. Deichmann, A.L. Lerner-Lam, M. Arnold, J. Agwe, P. Buys, O. Kjekstad, B. Lyon, and G. Yetman. 2005. Natural Disaster Hotspots: A Global Risk Analysis. Washington, D.C.: World Bank. https://doi.org/10.1596/0-8213-5930-4.
- Center for Hazards and Risk Research - CHRR - Columbia University, Center for International Earth Science Information Network - CIESIN - Columbia University, and International Research Institute for Climate and Society - IRI - Columbia University. 2005. Global Drought Hazard Frequency and Distribution. Palisades, NY: NASA Socioeconomic Data and Applications Center (SEDAC). https://doi.org/10.7927/H4VX0DFT.
- Center for Hazards and Risk Research - CHRR - Columbia University, Center for International Earth Science Information Network - CIESIN - Columbia University. 2005. Global Earthquake Hazard Distribution - Peak Ground Acceleration. Palisades, NY: NASA Socioeconomic Data and Applications Center (SEDAC). https://doi.org/10.7927/H4BZ63ZS.
Recent Nearby Earthquakes
Magnitude 3.0 and greater
| Date▼ | Time↕ | Magnitude↕ | Distance↕ | Depth↕ | Location↕ | Link |
|---|---|---|---|---|---|---|
| 10/1/15 | 8:15 PM | 4.4 | 37.1 km | 5,000 m | 45km S of Ritchie, South Africa | usgs.gov |
| 1/8/02 | 5:32 AM | 4.7 | 84.6 km | 5,000 m | South Africa | usgs.gov |
| 1/8/02 | 5:32 AM | 4.1 | 71.8 km | 5,000 m | South Africa | usgs.gov |
| 7/3/99 | 8:53 PM | 4.5 | 47.1 km | 5,000 m | South Africa | usgs.gov |
| 5/8/85 | 11:35 AM | 4.8 | 57.3 km | 5,000 m | South Africa | usgs.gov |
| 9/5/83 | 12:33 AM | 4.7 | 58.3 km | 5,000 m | South Africa | usgs.gov |
| 7/1/76 | 11:24 AM | 5.9 | 45.8 km | 33,000 m | South Africa | usgs.gov |
| 6/8/75 | 6:32 PM | 4.4 | 62 km | 33,000 m | South Africa | usgs.gov |
Luckhoff
Lückhoff is a small merino sheep farming town in the Free State province of South Africa. It was established on the farm Koffiekuil in 1892 and named after a Dutch Reformed Church minister Reverend HJ Luckhoff. the bulk of the sheep found in this di..
Luckhoff Wikipedia Page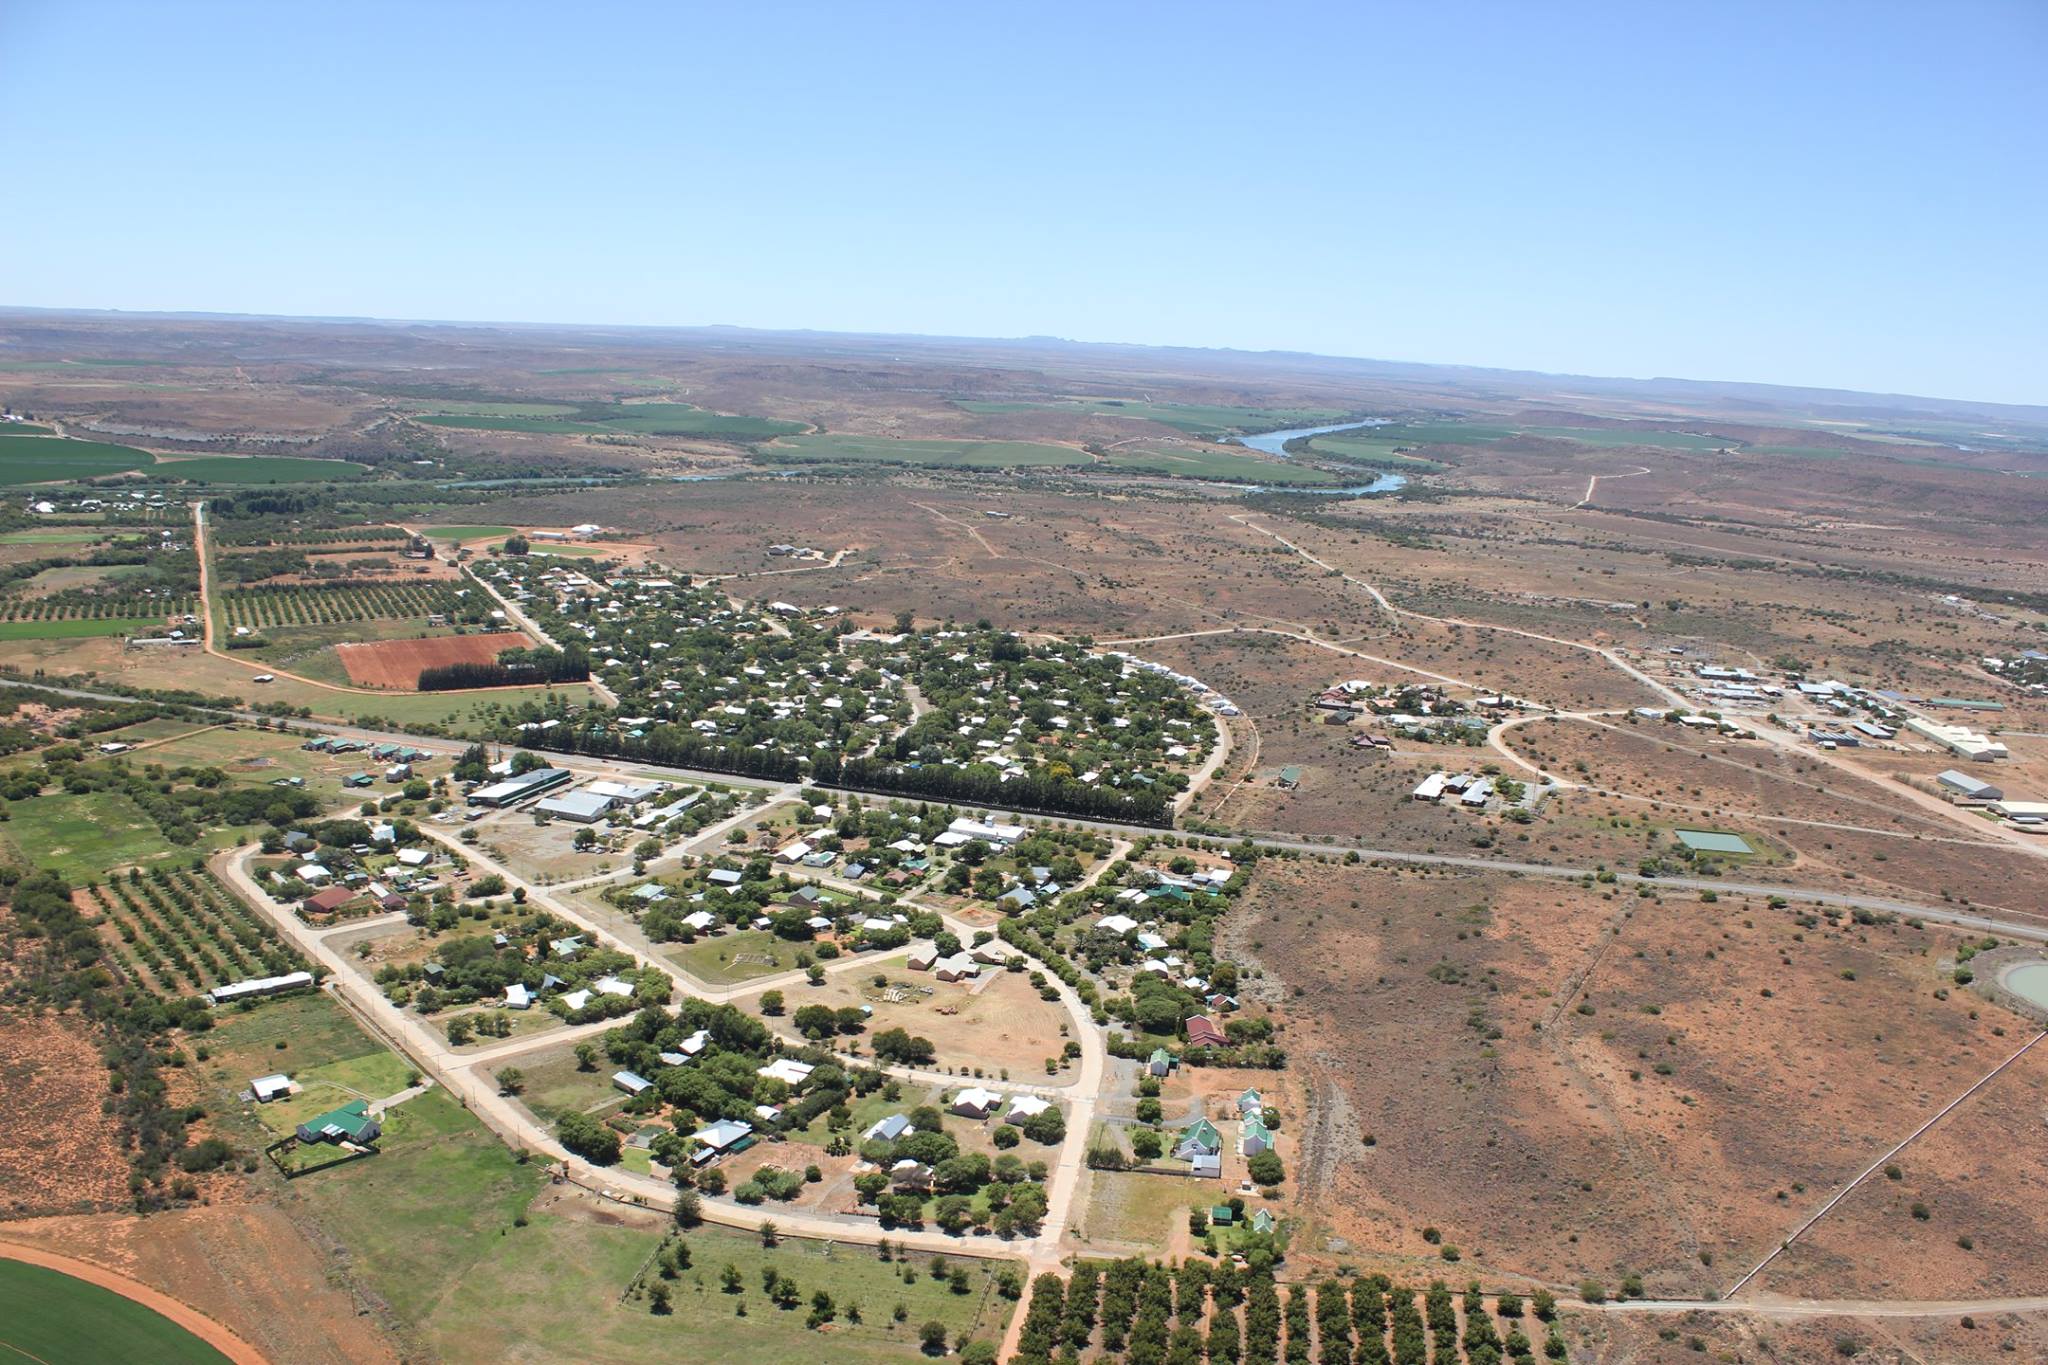


About Our Data
The data on this page is estimated using a number of publicly available tools and resources. It is provided without warranty, and could contain inaccuracies. Use at your own risk.