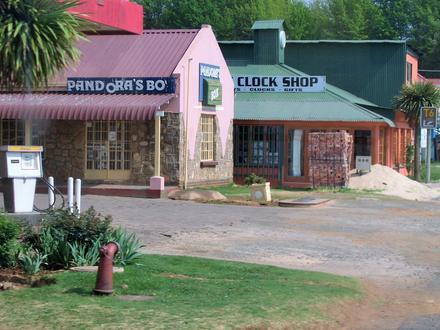
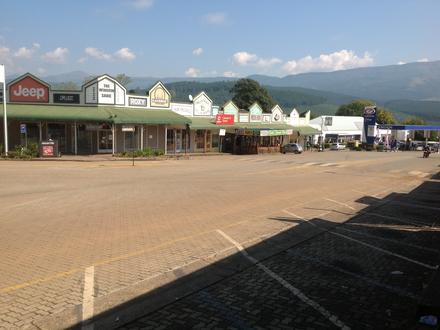
Businesses in Ohrigstad
Industries
Business Distribution by Industry Industry: 17.7%
Shopping: 17.7%
Restaurants: 16.7%
Hotels & Travel: 16.7%
Food: 9.4%
Automotive: 5.2%
Professional Services: 4.2%
Other: 12.5%
| Area of Ohrigstad, Mpumalanga | 1.398 km² |
| Population | 345 |
| Male Population | 180 (52%) |
| Female Population | 165 (48%) |
| Population change from 1975 to 2015 | +213.6% |
| Population change from 2000 to 2015 | +29.2% |
| Median Age | 37.1 |
| Male Median Age | 37.3 |
| Female Median Age | 36.8 |
| Neighborhoods | Ohrigstad |
| Local Time | Thursday 2:35 PM |
| Timezone | South Africa Standard Time |
| Lat & Lng | -24.74672° / 30.56466° |
Ohrigstad, Mpumalanga - Map
Ohrigstad, Mpumalanga Population
Years 1975 to 2015| Data | 1975 | 1990 | 2000 | 2015 |
|---|---|---|---|---|
| Population | 110 | 196 | 267 | 345 |
| Population Density | 78.7 / km² | 140.2 / km² | 191.0 / km² | 246.8 / km² |
Ohrigstad Population change from 2000 to 2015
Increase of 29.2% from year 2000 to 2015| Location | Change since 1975 | Change since 1990 | Change since 2000 |
|---|---|---|---|
| Ohrigstad, Mpumalanga | +213.6% | +76% | +29.2% |
| Limpopo | +69% | +26.1% | +9.4% |
| South Africa | +111.9% | +48.1% | +21.4% |
Ohrigstad, Mpumalanga Median Age
Median Age: 37.1 years| Location | Median Age | Median Age (Female) | Median Age (Male) |
|---|---|---|---|
| Ohrigstad, Mpumalanga | 37.1 years | 36.8 years | 37.3 years |
| Limpopo | 22.3 years | 24.1 years | 20.3 years |
| South Africa | 25.4 years | 26.3 years | 24.5 years |
Ohrigstad, Mpumalanga Population Tree
Population By Age and Gender| Age | Male | Female | Total |
|---|---|---|---|
| Under 5 | 13 | 14 | 28 |
| 5-9 | 9 | 9 | 18 |
| 10-14 | 6 | 9 | 15 |
| 15-19 | 8 | 5 | 13 |
| 20-24 | 12 | 5 | 18 |
| 25-29 | 12 | 21 | 34 |
| 30-34 | 20 | 16 | 36 |
| 35-39 | 21 | 11 | 32 |
| 40-44 | 13 | 14 | 28 |
| 45-49 | 11 | 12 | 23 |
| 50-54 | 17 | 16 | 33 |
| 55-59 | 9 | 12 | 22 |
| 60-64 | 14 | 8 | 23 |
| 65-69 | 8 | 7 | 15 |
| 70-74 | 3 | 1 | 4 |
| 75-79 | 1 | 2 | 4 |
| 80-84 | 3 | 4 | 7 |
| 85 Plus | 0 | 0 | 1 |
Ohrigstad, Mpumalanga Population Density
Population Density: 246.8 / km²| Location | Population | Area | Population Density |
|---|---|---|---|
| Ohrigstad, Mpumalanga | 345 | 1.398 km² | 246.8 / km² |
| Limpopo | 5.5 million | 125,754 km² | 44.0 / km² |
| South Africa | 54.3 million | 1,219,846.5 km² | 44.5 / km² |
Ohrigstad, Mpumalanga Historical and Projected Population
Estimated Population from 1880 to 2100Sources:
1. JRC (European Commission's Joint Research Centre) work on the GHS built-up grid
2. CIESIN (Center for International Earth Science Information Network)
3. [Link] Klein Goldewijk, K., Beusen, A., Doelman, J., and Stehfest, E.: Anthropogenic land use estimates for the Holocene – HYDE 3.2, Earth Syst. Sci. Data, 9, 927–953, https://doi.org/10.5194/essd-9-927-2017, 2017.
Area Codes
Percentage Area Codes used by businesses in Ohrigstad Area Code 13: 25%
Area Code 15: 25%
Area Code 82: 25%
Area Code 7: 12.5%
Area Code 83: 12.5%
Human Development Index (HDI)
Statistic composite index of life expectancy, education, and per capita income.Sources: [Link] Kummu, M., Taka, M. & Guillaume, J. Gridded global datasets for Gross Domestic Product and Human Development Index over 1990–2015. Sci Data 5, 180004 (2018) doi:10.1038/sdata.2018.4
Ohrigstad, Mpumalanga CO2 Emissions
Carbon Dioxide (CO2) Emissions Per Capita in Tonnes Per Year| Location | CO2 Emissions | CO2 Emissions Per Capita | CO2 Emissions Intensity |
|---|---|---|---|
| Ohrigstad, Mpumalanga | 1,787 tn | 5.18 tn | 1,278 tons/km² |
| Limpopo | 34,273,198 tn | 6.19 tn | 272.5 tons/km² |
| South Africa | 358,473,407 tn | 6.6 tn | 293.9 tons/km² |
Ohrigstad, Mpumalanga CO2 Emissions
| 2013 CO2 emissions (tonnes/year) | 1,787 tn |
| 2013 CO2 emissions (tonnes/year) per capita | 5.18 tn |
| 2013 CO2 emissions intensity (tonnes/km²/year) | 1,278 tons/km² |
Natural Hazards Risk
Relative risk out of 10| Drought | Medium (5) |
* Risk, particularly concerning flood or landslide, may not be for the entire area.
Sources: 1. Dilley, M., R.S. Chen, U. Deichmann, A.L. Lerner-Lam, M. Arnold, J. Agwe, P. Buys, O. Kjekstad, B. Lyon, and G. Yetman. 2005. Natural Disaster Hotspots: A Global Risk Analysis. Washington, D.C.: World Bank. https://doi.org/10.1596/0-8213-5930-4.
2. Center for Hazards and Risk Research - CHRR - Columbia University, Center for International Earth Science Information Network - CIESIN - Columbia University, and International Research Institute for Climate and Society - IRI - Columbia University. 2005. Global Drought Hazard Frequency and Distribution. Palisades, NY: NASA Socioeconomic Data and Applications Center (SEDAC). https://doi.org/10.7927/H4VX0DFT.
Recent Nearby Earthquakes
Magnitude 3.0 and greaterOhrigstad, Mpumalanga
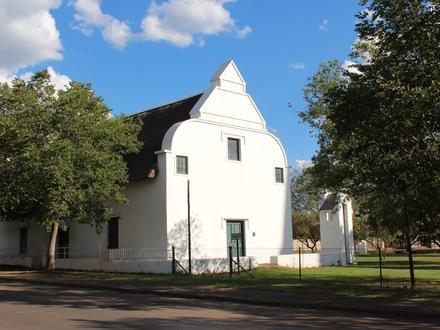
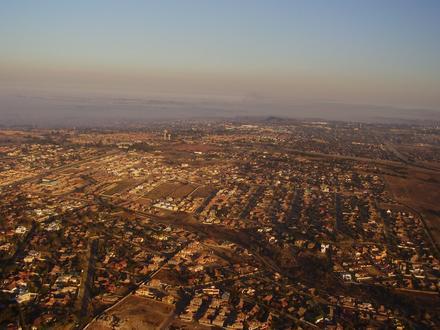
Ohrigstad (Afrikaans for Ohrig city), formerly Andries Orieg Stad, is a small town to the north of Lydenburg in the Limpopo province, South Africa. Ohrigstad Wikipedia Page
About Our Data
The data on this page is estimated using a number of publicly available tools and resources. It is provided without warranty, and could contain inaccuracies. Use at your own risk. See here for more information.