Tashtun Facts
| Area | 52.5 km² |
| Population | 97 |
| Male Population | 53 (54.9%) |
| Female Population | 44 (45.1%) |
| Population change (1975 to 2020) | +7.8% |
| Population change (2000 to 2020) | +11.5% |
| Median Age | 33.2 years (Male: 31.6, Female: 35.2) |
| GDP per capita (PPP) | $11,744 (2022) |
| Local Time | |
| Timezone | Armenia Standard Time |
| Lat & Lng | 39.06619, 46.16914 |
Map of Tashtun
Interactive Map
Tashtun Population
Years 1975 to 2030
| Data | 1975 | 1990 | 2000 | 2015 | 2020 | 2025* | 2030* |
|---|---|---|---|---|---|---|---|
| Population | 90 | 104 | 87 | 80 | 97 | 92 | 89 |
| Population Density | 1.7 / km² | 2 / km² | 1.7 / km² | 1.5 / km² | 1.8 / km² | 1.8 / km² | 1.7 / km² |
Tashtun Population change from 2000 to 2020
Increase of 11.5% from year 2000 to 2020
| Location | Change since 1975 | Change since 1990 | Change since 2000 |
|---|---|---|---|
| Tashtun | +7.8% | -6.7% | +11.5% |
| Syunik Province | — | — | — |
| Armenia | — | — | — |
Tashtun Median Age
Median Age: 33.2 years
| Location | Median Age | Median Age (Female) | Median Age (Male) |
|---|---|---|---|
| Tashtun | 33.2 yrs | 35.2 yrs | 31.6 yrs |
| Syunik Province | 33.3 yrs | 35.2 yrs | 31.4 yrs |
| Armenia | 33.1 yrs | 35.3 yrs | 30.8 yrs |
Tashtun Population Density
Population Density: 1.8 / km²
| Location | Population | Area | Density |
|---|---|---|---|
| Tashtun | 97 | 52.5 km² | 1.8 / km² |
| Syunik Province | 99,374 | 4,404.1 km² | 22.6 / km² |
| Armenia | 3 million | 29,714.7 km² | 102 / km² |
Tashtun Historical and Projected Population
Estimated Population from 0 to 2100
- JRC (European Commission's Joint Research Centre) work on the GHS built-up grid
- CIESIN (Center for International Earth Science Information Network)
- [Link] Klein Goldewijk, K., Beusen, A., Doelman, J., and Stehfest, E.: Anthropogenic land use estimates for the Holocene – HYDE 3.2, Earth Syst. Sci. Data, 9, 927–953, https://doi.org/10.5194/essd-9-927-2017, 2017.
Human Development Index (HDI)
Statistic composite index of life expectancy, education, and per capita income.
Tashtun Gross Domestic Product (GDP)
GDP per capita, PPP (constant 2017 international $)
| Data | 1990 | 1995 | 2000 | 2005 | 2010 | 2015 | 2020 | 2022 |
|---|---|---|---|---|---|---|---|---|
| GDP per capita | $3,977 | $2,071 | $2,747 | $4,307 | $5,457 | $7,339 | $9,311 | $11,744 |
| Total GDP | $38.9M | $17.8M | $21.7M | $32.5M | $39.8M | $51M | $64.6M | $79.9M |
Tashtun CO2 Emissions
Carbon Dioxide (CO2) Emissions Per Capita in Tonnes Per Year
| Location | CO2 Emissions | CO2 Emissions Per Capita | CO2 Emissions Intensity |
|---|---|---|---|
| Tashtun | 229 tn | 2.36 tn | 4.4 tons/km² |
| Syunik Province | 238,978 tn | 2.4 tn | 54.3 tons/km² |
| Armenia | 6,386,017 tn | 2.12 tn | 214.9 tons/km² |
| 2013 CO2 emissions (tonnes/year) | 229 tn |
| 2013 CO2 emissions (tonnes/year) per capita | 2.36 tn |
| 2013 CO2 emissions intensity (tonnes/km²/year) | 4.4 tons/km² |
Natural Hazards Risk
Relative risk out of 10
| Hazard | Risk Level |
|---|---|
| Drought | High (8) |
| Earthquake | Medium (7) |
| Landslide | Medium (6) |
* Risk, particularly concerning flood or landslide, may not be for the entire area.
- Dilley, M., R.S. Chen, U. Deichmann, A.L. Lerner-Lam, M. Arnold, J. Agwe, P. Buys, O. Kjekstad, B. Lyon, and G. Yetman. 2005. Natural Disaster Hotspots: A Global Risk Analysis. Washington, D.C.: World Bank. https://doi.org/10.1596/0-8213-5930-4.
- Center for Hazards and Risk Research - CHRR - Columbia University, Center for International Earth Science Information Network - CIESIN - Columbia University, and Norwegian Geotechnical Institute - NGI. 2005. Global Landslide Hazard Distribution. Palisades, NY: NASA Socioeconomic Data and Applications Center (SEDAC). https://doi.org/10.7927/H4P848VZ.
- Center for Hazards and Risk Research - CHRR - Columbia University, Center for International Earth Science Information Network - CIESIN - Columbia University, and International Research Institute for Climate and Society - IRI - Columbia University. 2005. Global Drought Hazard Frequency and Distribution. Palisades, NY: NASA Socioeconomic Data and Applications Center (SEDAC). https://doi.org/10.7927/H4VX0DFT.
- Center for Hazards and Risk Research - CHRR - Columbia University, Center for International Earth Science Information Network - CIESIN - Columbia University. 2005. Global Earthquake Hazard Distribution - Peak Ground Acceleration. Palisades, NY: NASA Socioeconomic Data and Applications Center (SEDAC). https://doi.org/10.7927/H4BZ63ZS.
Recent Nearby Earthquakes
Magnitude 3.0 and greater
| Date▼ | Time↕ | Magnitude↕ | Distance↕ | Depth↕ | Location↕ | Link |
|---|---|---|---|---|---|---|
| 4/16/18 | 12:02 AM | 3.5 | 95.5 km | 10,000 m | 33km W of Marand, Iran | usgs.gov |
| 2/28/17 | 6:17 AM | 3.6 | 34.6 km | 10,000 m | 5km NW of Agarak, Armenia | usgs.gov |
| 8/2/16 | 10:15 AM | 3.8 | 85.4 km | 7,700 m | 29km W of Ahar, Iran | usgs.gov |
| 1/7/15 | 11:00 PM | 4.1 | 29.6 km | 10,000 m | 18km SSE of Hats'avan, Armenia | usgs.gov |
| 12/15/14 | 4:05 AM | 4.2 | 96.1 km | 24,310 m | 21km SSE of Qarah Zia' od Din, Iran | usgs.gov |
| 6/28/13 | 5:13 AM | 4.2 | 98.5 km | 14,800 m | 28km WSW of Marand, Iran | usgs.gov |
| 4/18/13 | 10:39 AM | 4.8 | 97.3 km | 10,300 m | 27km W of Marand, Iran | usgs.gov |
| 3/8/13 | 1:45 PM | 4 | 89.1 km | 4,000 m | northwestern Iran | usgs.gov |
| 3/3/13 | 8:59 PM | 4.2 | 86.3 km | 6,000 m | northwestern Iran | usgs.gov |
| 2/12/13 | 10:24 PM | 4.2 | 81.2 km | 10,000 m | northwestern Iran | usgs.gov |
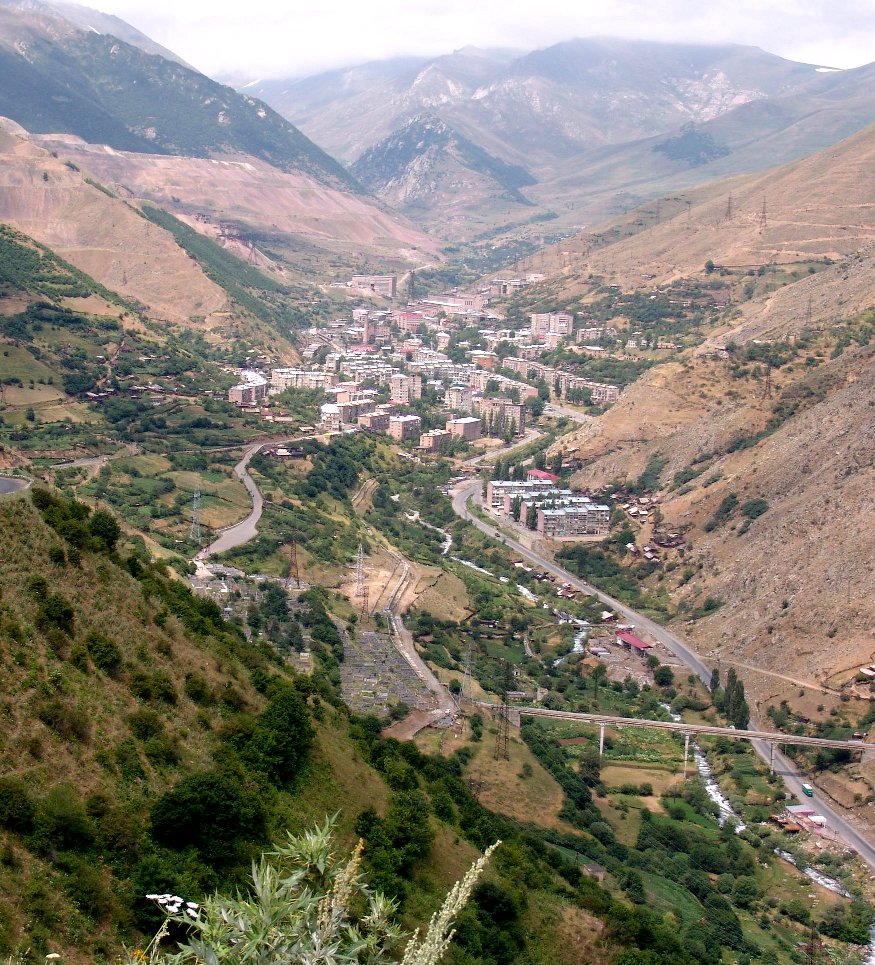
Tashtun
Tashtun (Armenian: Տաշտուն) is a village and rural community (municipality) in the Syunik Province of Armenia. The National Statistical Service of the Republic of Armenia (ARMSTAT) reported its population was 134 in 2010, down from 170 at the 2001 ce..
Tashtun Wikipedia Page
About Our Data
The data on this page is estimated using a number of publicly available tools and resources. It is provided without warranty, and could contain inaccuracies. Use at your own risk.