Businesses in Añelo
Hotels & Travel
Restaurants
Automotive
Financial Services
Medical
Beauty & Spas
Community & Government
| Area of Añelo, Neuquén Province | 0.791 km² |
| Population | 1,287 |
| Population change from 1975 to 2015 | +3,685.3% |
| Population change from 2000 to 2015 | +142.4% |
| Area Codes | 299 |
| Local Time | Thursday 8:02 PM |
| Timezone | Argentina Standard Time |
| Lat & Lng | -38.35441° / -68.7884° |
Añelo, Neuquén Province - Map
Añelo, Neuquén Province Population
Years 1975 to 2015| Data | 1975 | 1990 | 2000 | 2015 |
|---|---|---|---|---|
| Population | 34 | 96 | 531 | 1,287 |
| Population Density | 43.0 / km² | 121.4 / km² | 671.3 / km² | 1,626 / km² |
Añelo Population change from 2000 to 2015
Increase of 142.4% from year 2000 to 2015| Location | Change since 1975 | Change since 1990 | Change since 2000 |
|---|---|---|---|
| Añelo, Neuquén Province | +3,685.3% | +1,240.6% | +142.4% |
| Neuquen | +105.6% | +51.9% | +27.4% |
| Argentina | +66.4% | +32.6% | +17.1% |
Añelo, Neuquén Province Population Density
Population Density: 1,626 / km²| Location | Population | Area | Population Density |
|---|---|---|---|
| Añelo, Neuquén Province | 1,287 | 0.791 km² | 1,626 / km² |
| Neuquen | 613,365 | 94,454.9 km² | 6.49 / km² |
| Argentina | 43.2 million | 2,779,516.9 km² | 15.5 / km² |
Añelo, Neuquén Province Historical and Projected Population
Estimated Population from 1970 to 2100Sources:
1. JRC (European Commission's Joint Research Centre) work on the GHS built-up grid
2. CIESIN (Center for International Earth Science Information Network)
3. [Link] Klein Goldewijk, K., Beusen, A., Doelman, J., and Stehfest, E.: Anthropogenic land use estimates for the Holocene – HYDE 3.2, Earth Syst. Sci. Data, 9, 927–953, https://doi.org/10.5194/essd-9-927-2017, 2017.
Human Development Index (HDI)
Statistic composite index of life expectancy, education, and per capita income.Sources: [Link] Kummu, M., Taka, M. & Guillaume, J. Gridded global datasets for Gross Domestic Product and Human Development Index over 1990–2015. Sci Data 5, 180004 (2018) doi:10.1038/sdata.2018.4
Añelo, Neuquén Province CO2 Emissions
Carbon Dioxide (CO2) Emissions Per Capita in Tonnes Per Year| Location | CO2 Emissions | CO2 Emissions Per Capita | CO2 Emissions Intensity |
|---|---|---|---|
| Añelo, Neuquén Province | 5,531 tn | 4.3 tn | 6,992 tons/km² |
| Neuquen | 2,917,972 tn | 4.76 tn | 30.9 tons/km² |
| Argentina | 198,107,944 tn | 4.59 tn | 71.3 tons/km² |
Añelo, Neuquén Province CO2 Emissions
| 2013 CO2 emissions (tonnes/year) | 5,531 tn |
| 2013 CO2 emissions (tonnes/year) per capita | 4.3 tn |
| 2013 CO2 emissions intensity (tonnes/km²/year) | 6,992 tons/km² |
Natural Hazards Risk
Relative risk out of 10| Earthquake | Medium (4) |
* Risk, particularly concerning flood or landslide, may not be for the entire area.
Sources: 1. Dilley, M., R.S. Chen, U. Deichmann, A.L. Lerner-Lam, M. Arnold, J. Agwe, P. Buys, O. Kjekstad, B. Lyon, and G. Yetman. 2005. Natural Disaster Hotspots: A Global Risk Analysis. Washington, D.C.: World Bank. https://doi.org/10.1596/0-8213-5930-4.
2. Center for Hazards and Risk Research - CHRR - Columbia University, Center for International Earth Science Information Network - CIESIN - Columbia University. 2005. Global Earthquake Hazard Distribution - Peak Ground Acceleration. Palisades, NY: NASA Socioeconomic Data and Applications Center (SEDAC). https://doi.org/10.7927/H4BZ63ZS.
Recent Nearby Earthquakes
Magnitude 3.0 and greater| Date | Time | Magnitude | Distance | Depth | Location | Link |
|---|---|---|---|---|---|---|
| 3/6/19 | 9:10 PM | 5 | 19.7 km | 13,840 m | 19km SSW of Anelo, Argentina | usgs.gov |
| 1/9/19 | 9:55 AM | 3.4 | 28.6 km | 1,000 m | 30km SE of Anelo, Argentina | usgs.gov |
| 9/25/17 | 6:04 PM | 4.4 | 46.5 km | 19,700 m | 46km ENE of Anelo, Argentina | usgs.gov |
| 11/19/15 | 9:44 AM | 4.2 | 62.9 km | 14,630 m | 21km E of Plaza Huincul, Argentina | usgs.gov |
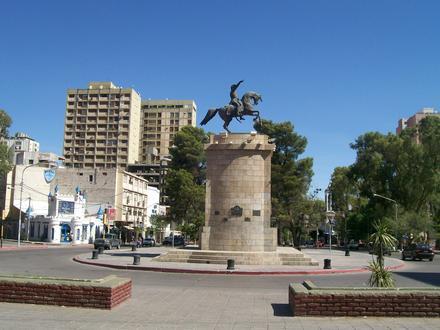
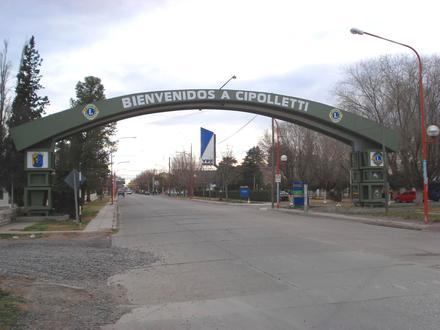
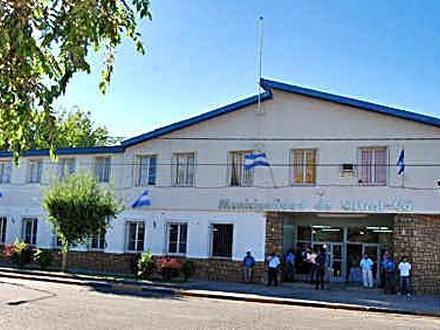
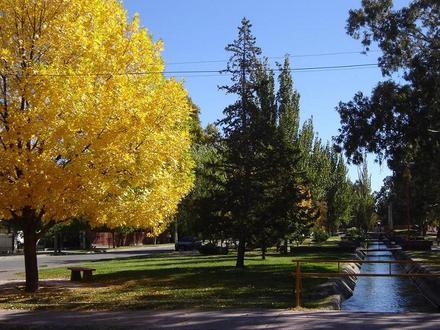
Añelo, Neuquén Province
Añelo is a second category municipality located in the Añelo Department in Neuquén Province, Argentina. Añelo Wikipedia Page
About Our Data
The data on this page is estimated using a number of publicly available tools and resources. It is provided without warranty, and could contain inaccuracies. Use at your own risk. See here for more information.