Businesses in Embalse, Córdoba
Hotels & Travel
Restaurants
Automotive
Financial Services
Medical
Beauty & Spas
Community & Government
Industries
Business Distribution by Industry Shopping: 21.6%
Hotels & Travel: 20.4%
Food: 10.6%
Restaurants: 9.5%
Sports & Activities: 5.9%
Industry: 5.2%
Home Services: 4.9%
Other: 21.9%
| Industry Description | Number of Establishments | Average Google Rating | Businesses per 1,000 residents |
|---|---|---|---|
| Other accommodation | 15 | 4.1 | 2.4 |
| Area of Embalse, Córdoba | 4.948 km² |
| Population | 6,300 |
| Population change from 1975 to 2015 | +161.3% |
| Population change from 2000 to 2015 | +19.1% |
| Area Codes | 3549, 3571 |
| Local Time | Sunday 12:19 AM |
| Timezone | Argentina Standard Time |
| Lat & Lng | -32.18° / -64.41809° |
Embalse, Córdoba - Map
Embalse, Córdoba Population
Years 1975 to 2015| Data | 1975 | 1990 | 2000 | 2015 |
|---|---|---|---|---|
| Population | 2,411 | 4,434 | 5,289 | 6,300 |
| Population Density | 487.2 / km² | 896.1 / km² | 1,068 / km² | 1,273 / km² |
Embalse, Córdoba Population change from 2000 to 2015
Increase of 19.1% from year 2000 to 2015| Location | Change since 1975 | Change since 1990 | Change since 2000 |
|---|---|---|---|
| Embalse, Córdoba | +161.3% | +42.1% | +19.1% |
| Cordoba | +51% | +24% | +12.2% |
| Argentina | +66.4% | +32.6% | +17.1% |
Embalse, Córdoba Population Density
Population Density: 1,273 / km²| Location | Population | Area | Population Density |
|---|---|---|---|
| Embalse, Córdoba | 6,300 | 4.948 km² | 1,273 / km² |
| Cordoba | 3.5 million | 164,773.3 km² | 21.4 / km² |
| Argentina | 43.2 million | 2,779,516.9 km² | 15.5 / km² |
Embalse, Córdoba Historical and Projected Population
Estimated Population from 1850 to 2100Sources:
1. JRC (European Commission's Joint Research Centre) work on the GHS built-up grid
2. CIESIN (Center for International Earth Science Information Network)
3. [Link] Klein Goldewijk, K., Beusen, A., Doelman, J., and Stehfest, E.: Anthropogenic land use estimates for the Holocene – HYDE 3.2, Earth Syst. Sci. Data, 9, 927–953, https://doi.org/10.5194/essd-9-927-2017, 2017.
Human Development Index (HDI)
Statistic composite index of life expectancy, education, and per capita income.Sources: [Link] Kummu, M., Taka, M. & Guillaume, J. Gridded global datasets for Gross Domestic Product and Human Development Index over 1990–2015. Sci Data 5, 180004 (2018) doi:10.1038/sdata.2018.4
Embalse, Córdoba CO2 Emissions
Carbon Dioxide (CO2) Emissions Per Capita in Tonnes Per Year| Location | CO2 Emissions | CO2 Emissions Per Capita | CO2 Emissions Intensity |
|---|---|---|---|
| Embalse, Córdoba | 30,416 tn | 4.83 tn | 6,146 tons/km² |
| Cordoba | 16,457,250 tn | 4.67 tn | 99.9 tons/km² |
| Argentina | 198,107,944 tn | 4.59 tn | 71.3 tons/km² |
Embalse, Córdoba CO2 Emissions
| 2013 CO2 emissions (tonnes/year) | 30,416 tn |
| 2013 CO2 emissions (tonnes/year) per capita | 4.83 tn |
| 2013 CO2 emissions intensity (tonnes/km²/year) | 6,146 tons/km² |
Natural Hazards Risk
Relative risk out of 10| Drought | High (10) |
| Flood | Medium (4) |
| Earthquake | Medium (4) |
* Risk, particularly concerning flood or landslide, may not be for the entire area.
Sources: 1. Dilley, M., R.S. Chen, U. Deichmann, A.L. Lerner-Lam, M. Arnold, J. Agwe, P. Buys, O. Kjekstad, B. Lyon, and G. Yetman. 2005. Natural Disaster Hotspots: A Global Risk Analysis. Washington, D.C.: World Bank. https://doi.org/10.1596/0-8213-5930-4.
2. Center for Hazards and Risk Research - CHRR - Columbia University, Center for International Earth Science Information Network - CIESIN - Columbia University, and International Research Institute for Climate and Society - IRI - Columbia University. 2005. Global Drought Hazard Frequency and Distribution. Palisades, NY: NASA Socioeconomic Data and Applications Center (SEDAC). https://doi.org/10.7927/H4VX0DFT.
3. Center for Hazards and Risk Research - CHRR - Columbia University, Center for International Earth Science Information Network - CIESIN - Columbia University. 2005. Global Earthquake Hazard Distribution - Peak Ground Acceleration. Palisades, NY: NASA Socioeconomic Data and Applications Center (SEDAC). https://doi.org/10.7927/H4BZ63ZS.
4. Center for Hazards and Risk Research - CHRR - Columbia University, Center for International Earth Science Information Network - CIESIN - Columbia University. 2005. Global Flood Hazard Frequency and Distribution. Palisades, NY: NASA Socioeconomic Data and Applications Center (SEDAC). https://doi.org/10.7927/H4668B3D.
Recent Nearby Earthquakes
Magnitude 3.0 and greater| Date | Time | Magnitude | Distance | Depth | Location | Link |
|---|---|---|---|---|---|---|
| 8/11/19 | 7:30 PM | 4 | 77.8 km | 10,000 m | 17km NNW of Santa Rosa del Conlara, Argentina | usgs.gov |
| 6/14/19 | 10:15 PM | 3.4 | 73.3 km | 10,000 m | 9km NE of Villa Dolores, Argentina | usgs.gov |
| 4/18/18 | 8:29 AM | 3.9 | 56.9 km | 10,000 m | 4km NNE of Merlo, Argentina | usgs.gov |
| 11/1/16 | 6:26 PM | 3.3 | 75.7 km | 33,000 m | 4km SSW of Malagueno, Argentina | usgs.gov |
| 7/21/16 | 6:25 PM | 3.3 | 71.9 km | 24,000 m | 7km ENE of Mina Clavero, Argentina | usgs.gov |
| 7/21/16 | 6:25 PM | 3.8 | 71.9 km | 24,000 m | 7km ENE of Mina Clavero, Argentina | usgs.gov |
| 6/25/16 | 9:17 PM | 3.2 | 76.7 km | 17,000 m | 14km SW of Mina Clavero, Argentina | usgs.gov |
| 10/11/15 | 9:36 PM | 3.1 | 94.5 km | 10,200 m | 17km NNW of Villa Cura Brochero, Argentina | usgs.gov |
| 9/11/13 | 6:43 PM | 4.7 | 73.2 km | 20,000 m | 3km E of Mina Clavero, Argentina | usgs.gov |
| 12/17/12 | 12:38 AM | 4.4 | 83.8 km | 20,000 m | San Luis, Argentina | usgs.gov |
Find historical earthquake occurrences near Embalse, Córdoba
Earliest Date Latest Date
Magnitude 3.0 and greater Magnitude 4.0 and greater Magnitude 5.0 and greater
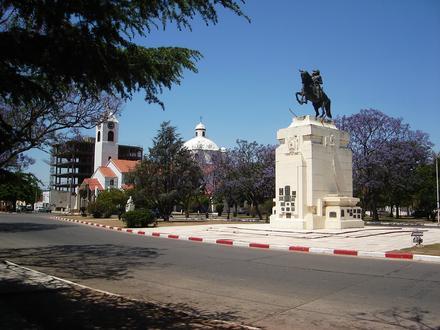
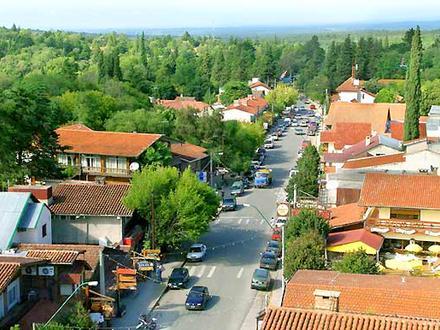
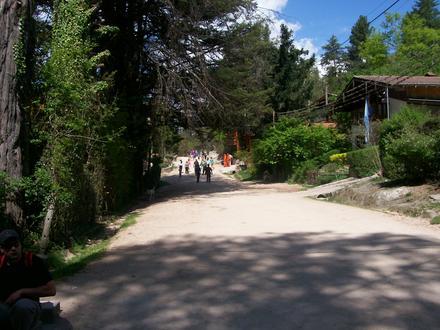
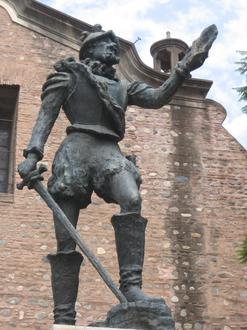
Embalse, Córdoba
Embalse is a town in the center-west of the province of Córdoba, Argentina, located within the Calamuchita Valley, 119 km south-southwest from Córdoba City. The municipality has 7,400 inhabitants as per the 2001 census [INDEC], though unofficial coun.. Embalse, Córdoba Wikipedia Page
About Our Data
The data on this page is estimated using a number of publicly available tools and resources. It is provided without warranty, and could contain inaccuracies. Use at your own risk. See here for more information.