Businesses in Matheu, Buenos Aires
Hotels & Travel
Restaurants
Automotive
Financial Services
Medical
Beauty & Spas
Community & Government
Industries
Business Distribution by Industry Shopping: 24.7%
Food: 10.7%
Industry: 8.3%
Restaurants: 7.6%
Education: 6.9%
Automotive: 6.8%
Professional Services: 6.1%
Home Services: 5.2%
Hotels & Travel: 5.2%
Sports & Activities: 5%
Other: 13.4%
| Area of Matheu, Buenos Aires | 3.821 km² |
| Population | 15,243 |
| Male Population | 7,565 (49.6%) |
| Female Population | 7,678 (50.4%) |
| Population change from 1975 to 2015 | +443.6% |
| Population change from 2000 to 2015 | +24.3% |
| Median Age | 27.1 |
| Male Median Age | 26.4 |
| Female Median Age | 27.7 |
| Area Codes | 3488 |
| Local Time | Thursday 12:33 AM |
| Timezone | Argentina Standard Time |
| Lat & Lng | -34.38545° / -58.83292° |
Matheu, Buenos Aires - Map
Matheu, Buenos Aires Population
Years 1975 to 2015| Data | 1975 | 1990 | 2000 | 2015 |
|---|---|---|---|---|
| Population | 2,804 | 9,664 | 12,261 | 15,243 |
| Population Density | 733.9 / km² | 2,529 / km² | 3,209 / km² | 3,989 / km² |
Matheu, Buenos Aires Population change from 2000 to 2015
Increase of 24.3% from year 2000 to 2015| Location | Change since 1975 | Change since 1990 | Change since 2000 |
|---|---|---|---|
| Matheu, Buenos Aires | +443.6% | +57.7% | +24.3% |
| Buenos Aires | +79.8% | +40.2% | +21.5% |
| Argentina | +66.4% | +32.6% | +17.1% |
Matheu, Buenos Aires Median Age
Median Age: 27.1 years| Location | Median Age | Median Age (Female) | Median Age (Male) |
|---|---|---|---|
| Matheu, Buenos Aires | 27.1 years | 27.7 years | 26.4 years |
| Buenos Aires | 30.6 years | 31.8 years | 29.4 years |
| Argentina | 29.8 years | 30.9 years | 28.7 years |
Matheu, Buenos Aires Population Tree
Population By Age and Gender| Age | Male | Female | Total |
|---|---|---|---|
| Under 5 | 754 | 726 | 1,480 |
| 5-9 | 731 | 717 | 1,448 |
| 10-14 | 763 | 719 | 1,482 |
| 15-19 | 710 | 704 | 1,415 |
| 20-24 | 662 | 655 | 1,318 |
| 25-29 | 594 | 593 | 1,187 |
| 30-34 | 587 | 608 | 1,196 |
| 35-39 | 536 | 557 | 1,094 |
| 40-44 | 469 | 487 | 957 |
| 45-49 | 402 | 420 | 823 |
| 50-54 | 367 | 365 | 733 |
| 55-59 | 307 | 314 | 621 |
| 60-64 | 251 | 263 | 515 |
| 65-69 | 180 | 192 | 372 |
| 70-74 | 113 | 133 | 247 |
| 75-79 | 75 | 102 | 178 |
| 80-84 | 39 | 70 | 110 |
| 85 Plus | 23 | 54 | 78 |
Matheu, Buenos Aires Population Density
Population Density: 3,989 / km²| Location | Population | Area | Population Density |
|---|---|---|---|
| Matheu, Buenos Aires | 15,243 | 3.821 km² | 3,989 / km² |
| Buenos Aires | 17.0 million | 305,458.1 km² | 55.6 / km² |
| Argentina | 43.2 million | 2,779,516.9 km² | 15.5 / km² |
Matheu, Buenos Aires Historical and Projected Population
Estimated Population from 1900 to 2100Sources:
1. JRC (European Commission's Joint Research Centre) work on the GHS built-up grid
2. CIESIN (Center for International Earth Science Information Network)
3. [Link] Klein Goldewijk, K., Beusen, A., Doelman, J., and Stehfest, E.: Anthropogenic land use estimates for the Holocene – HYDE 3.2, Earth Syst. Sci. Data, 9, 927–953, https://doi.org/10.5194/essd-9-927-2017, 2017.
Area Codes
Percentage Area Codes used by businesses in Matheu, Buenos Aires Area Code 3488: 47.4%
Area Code 11: 34.2%
Area Code 341: 10.5%
Area Code 2346: 2.6%
Area Code 3487: 2.6%
Area Code 3755: 2.6%
Business distribution by price for Matheu, Buenos Aires
Inexpensive: 42.4%
Moderate: 33.3%
Expensive: 22.7%
Very Expensive: 1.5%
Human Development Index (HDI)
Statistic composite index of life expectancy, education, and per capita income.Sources: [Link] Kummu, M., Taka, M. & Guillaume, J. Gridded global datasets for Gross Domestic Product and Human Development Index over 1990–2015. Sci Data 5, 180004 (2018) doi:10.1038/sdata.2018.4
Matheu, Buenos Aires CO2 Emissions
Carbon Dioxide (CO2) Emissions Per Capita in Tonnes Per Year| Location | CO2 Emissions | CO2 Emissions Per Capita | CO2 Emissions Intensity |
|---|---|---|---|
| Matheu, Buenos Aires | 73,399 tn | 4.82 tn | 19,211 tons/km² |
| Buenos Aires | 82,275,874 tn | 4.85 tn | 269.4 tons/km² |
| Argentina | 198,107,944 tn | 4.59 tn | 71.3 tons/km² |
Matheu, Buenos Aires CO2 Emissions
| 2013 CO2 emissions (tonnes/year) | 73,399 tn |
| 2013 CO2 emissions (tonnes/year) per capita | 4.82 tn |
| 2013 CO2 emissions intensity (tonnes/km²/year) | 19,211 tons/km² |
Natural Hazards Risk
Relative risk out of 10| Drought | Low (2) |
| Flood | High (10) |
* Risk, particularly concerning flood or landslide, may not be for the entire area.
Sources: 1. Dilley, M., R.S. Chen, U. Deichmann, A.L. Lerner-Lam, M. Arnold, J. Agwe, P. Buys, O. Kjekstad, B. Lyon, and G. Yetman. 2005. Natural Disaster Hotspots: A Global Risk Analysis. Washington, D.C.: World Bank. https://doi.org/10.1596/0-8213-5930-4.
2. Center for Hazards and Risk Research - CHRR - Columbia University, Center for International Earth Science Information Network - CIESIN - Columbia University, and International Research Institute for Climate and Society - IRI - Columbia University. 2005. Global Drought Hazard Frequency and Distribution. Palisades, NY: NASA Socioeconomic Data and Applications Center (SEDAC). https://doi.org/10.7927/H4VX0DFT.
3. Center for Hazards and Risk Research - CHRR - Columbia University, Center for International Earth Science Information Network - CIESIN - Columbia University. 2005. Global Flood Hazard Frequency and Distribution. Palisades, NY: NASA Socioeconomic Data and Applications Center (SEDAC). https://doi.org/10.7927/H4668B3D.
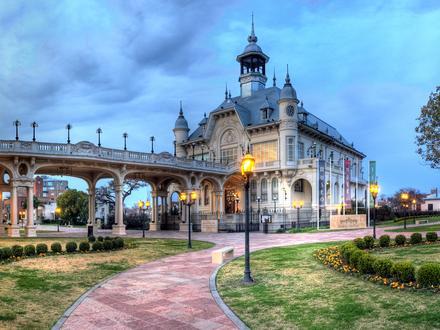
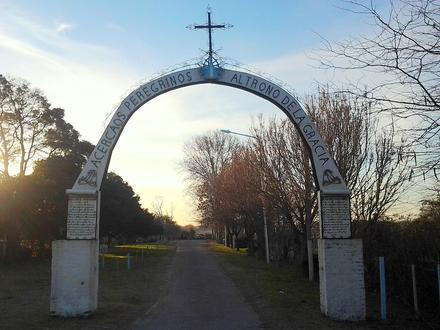
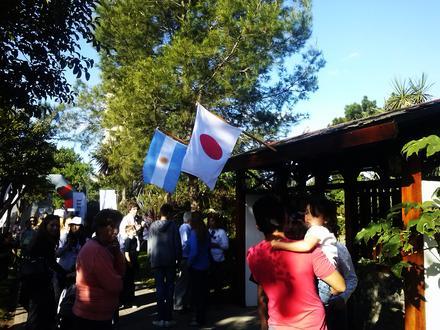
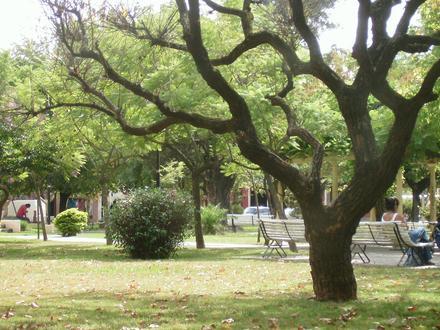
Matheu, Buenos Aires
Matheu is a town in the Escobar Partido of the Buenos Aires Province, Argentina. Matheu, Buenos Aires Wikipedia Page
About Our Data
The data on this page is estimated using a number of publicly available tools and resources. It is provided without warranty, and could contain inaccuracies. Use at your own risk. See here for more information.