Businesses in Ebensee
Hotels & Travel
Restaurants
Automotive
Financial Services
Medical
Beauty & Spas
Community & Government
Industries
Business Distribution by Industry Hotels & Travel: 15.2%
Shopping: 15.1%
Industry: 10.2%
Professional Services: 7.5%
Restaurants: 7.2%
Medical: 6.5%
Sports & Activities: 5.8%
Home Services: 5.4%
Other: 27.3%
| Industry Description | Number of Establishments | Average Google Rating | Businesses per 1,000 residents |
|---|---|---|---|
| Firefighting and rescue | 6 | 4.4 | 1.6 |
| Primary and elementary schools | 6 | 3.0 | 1.6 |
| Museums | 7 | 4.3 | 1.8 |
| Grocery stores and supermarkets | 7 | 4.2 | 1.8 |
| Holiday homes, cabins and resorts | 7 | 5.0 | 1.8 |
| Hostels | 6 | 4.2 | 1.6 |
| Hotels and motels | 26 | 4.4 | 6.8 |
| Other accommodation | 47 | 4.4 | 12.3 |
| Travel agencies | 7 | 4.5 | 1.8 |
| Other transport activities | 11 | 5.0 | 2.9 |
| Transportation logistics | 6 | 4.2 | 1.6 |
| Health and medical | 25 | 4.8 | 6.5 |
| Advertising and marketing | 7 | 4.6 | 1.8 |
| Bars, pubs and taverns | 12 | 4.3 | 3.1 |
| Cafes | 10 | 4.2 | 2.6 |
| Electronics stores | 11 | 4.9 | 2.9 |
| Shopping other | 6 | 4.0 | 1.6 |
| Sports clubs | 6 | 4.8 | 1.6 |
| Area of Ebensee, Upper Austria | 3.371 km² |
| Population | 3,822 |
| Male Population | 1,863 (48.8%) |
| Female Population | 1,959 (51.2%) |
| Population change from 1975 to 2015 | -43.2% |
| Population change from 2000 to 2015 | -16.7% |
| Median Age | 45.4 |
| Male Median Age | 43.5 |
| Female Median Age | 47.3 |
| Area Codes | 6133 |
| Neighborhoods | Kohlstatt, Langwies, Oberlangbath, Plankau, Rindbach, Roith, Unterlangbath |
| Local Time | Sunday 8:05 AM |
| Timezone | Central European Summer Time |
| Lat & Lng | 47.80716° / 13.779° |
Ebensee, Upper Austria - Map
Ebensee, Upper Austria Population
Years 1975 to 2015| Data | 1975 | 1990 | 2000 | 2015 |
|---|---|---|---|---|
| Population | 6,729 | 5,540 | 4,588 | 3,822 |
| Population Density | 1,996 / km² | 1,643 / km² | 1,360 / km² | 1,133 / km² |
Ebensee Population change from 2000 to 2015
Decrease of 16.7% from year 2000 to 2015| Location | Change since 1975 | Change since 1990 | Change since 2000 |
|---|---|---|---|
| Ebensee, Upper Austria | -43.2% | -31% | -16.7% |
| Upper Austria | +5.2% | +6.1% | +3.2% |
| Austria | +12.1% | +10.9% | +6.1% |
Ebensee, Upper Austria Median Age
Median Age: 45.4 years| Location | Median Age | Median Age (Female) | Median Age (Male) |
|---|---|---|---|
| Ebensee, Upper Austria | 45.4 years | 47.3 years | 43.5 years |
| Upper Austria | 42.1 years | 43.2 years | 40.9 years |
| Austria | 42.3 years | 43.5 years | 41.1 years |
Ebensee, Upper Austria Population Tree
Population By Age and Gender| Age | Male | Female | Total |
|---|---|---|---|
| Under 5 | 68 | 67 | 135 |
| 5-9 | 86 | 76 | 162 |
| 10-14 | 101 | 96 | 197 |
| 15-19 | 119 | 107 | 226 |
| 20-24 | 119 | 101 | 220 |
| 25-29 | 115 | 105 | 220 |
| 30-34 | 104 | 95 | 200 |
| 35-39 | 119 | 107 | 226 |
| 40-44 | 145 | 150 | 296 |
| 45-49 | 174 | 164 | 338 |
| 50-54 | 144 | 150 | 295 |
| 55-59 | 119 | 135 | 254 |
| 60-64 | 123 | 129 | 253 |
| 65-69 | 97 | 107 | 204 |
| 70-74 | 102 | 109 | 211 |
| 75-79 | 45 | 91 | 137 |
| 80-84 | 48 | 76 | 124 |
| 85 Plus | 37 | 95 | 132 |
Ebensee, Upper Austria Population Density
Population Density: 1,133 / km²| Location | Population | Area | Population Density |
|---|---|---|---|
| Ebensee, Upper Austria | 3,822 | 3.371 km² | 1,133 / km² |
| Upper Austria | 1.4 million | 11,984.6 km² | 117.9 / km² |
| Austria | 8.5 million | 83,905.5 km² | 101.7 / km² |
Ebensee, Upper Austria Projected Population
Estimated Population from 1975 to 2100Sources:
1. JRC (European Commission's Joint Research Centre) work on the GHS built-up grid
2. CIESIN (Center for International Earth Science Information Network)
3. [Link] Klein Goldewijk, K., Beusen, A., Doelman, J., and Stehfest, E.: Anthropogenic land use estimates for the Holocene – HYDE 3.2, Earth Syst. Sci. Data, 9, 927–953, https://doi.org/10.5194/essd-9-927-2017, 2017.
Neighborhoods
Business Distribution by neighborhood in Ebensee Rindbach: 23.8%
Langwies: 16.7%
Oberlangbath: 14.3%
Kohlstatt: 11.9%
Unterlangbath: 9.5%
Roith: 7.1%
Plankau: 7.1%
Trauneck: 4.8%
Other: 4.8%
Area Codes
Percentage Area Codes used by businesses in Ebensee Area Code 6133: 77.3%
Area Code 664: 7.3%
Other: 15.4%
Business distribution by price for Ebensee, Upper Austria
Moderate: 52.2%
Inexpensive: 39.1%
Expensive: 8.7%
Human Development Index (HDI)
Statistic composite index of life expectancy, education, and per capita income.Sources: [Link] Kummu, M., Taka, M. & Guillaume, J. Gridded global datasets for Gross Domestic Product and Human Development Index over 1990–2015. Sci Data 5, 180004 (2018) doi:10.1038/sdata.2018.4
Ebensee, Upper Austria CO2 Emissions
Carbon Dioxide (CO2) Emissions Per Capita in Tonnes Per Year| Location | CO2 Emissions | CO2 Emissions Per Capita | CO2 Emissions Intensity |
|---|---|---|---|
| Ebensee, Upper Austria | 40,379 tn | 10.6 tn | 11,977 tons/km² |
| Upper Austria | 14,901,656 tn | 10.5 tn | 1,243 tons/km² |
| Austria | 91,216,590 tn | 10.7 tn | 1,087 tons/km² |
Ebensee, Upper Austria CO2 Emissions
| 2013 CO2 emissions (tonnes/year) | 40,379 tn |
| 2013 CO2 emissions (tonnes/year) per capita | 10.6 tn |
| 2013 CO2 emissions intensity (tonnes/km²/year) | 11,977 tons/km² |
Natural Hazards Risk
Relative risk out of 10| Landslide | Medium (6) |
| Flood | Medium (4) |
| Earthquake | Medium (4) |
* Risk, particularly concerning flood or landslide, may not be for the entire area.
Sources: 1. Dilley, M., R.S. Chen, U. Deichmann, A.L. Lerner-Lam, M. Arnold, J. Agwe, P. Buys, O. Kjekstad, B. Lyon, and G. Yetman. 2005. Natural Disaster Hotspots: A Global Risk Analysis. Washington, D.C.: World Bank. https://doi.org/10.1596/0-8213-5930-4.
2. Center for Hazards and Risk Research - CHRR - Columbia University, Center for International Earth Science Information Network - CIESIN - Columbia University, and Norwegian Geotechnical Institute - NGI. 2005. Global Landslide Hazard Distribution. Palisades, NY: NASA Socioeconomic Data and Applications Center (SEDAC). https://doi.org/10.7927/H4P848VZ.
3. Center for Hazards and Risk Research - CHRR - Columbia University, Center for International Earth Science Information Network - CIESIN - Columbia University. 2005. Global Flood Hazard Frequency and Distribution. Palisades, NY: NASA Socioeconomic Data and Applications Center (SEDAC). https://doi.org/10.7927/H4668B3D.
4. Center for Hazards and Risk Research - CHRR - Columbia University, Center for International Earth Science Information Network - CIESIN - Columbia University. 2005. Global Earthquake Hazard Distribution - Peak Ground Acceleration. Palisades, NY: NASA Socioeconomic Data and Applications Center (SEDAC). https://doi.org/10.7927/H4BZ63ZS.
Recent Nearby Earthquakes
Magnitude 3.0 and greater| Date | Time | Magnitude | Distance | Depth | Location | Link |
|---|---|---|---|---|---|---|
| 8/12/08 | 10:25 AM | 3.8 | 49 km | 10,000 m | Austria | usgs.gov |
| 7/18/08 | 3:54 PM | 4.1 | 38.3 km | 10,000 m | Austria | usgs.gov |
| 6/22/08 | 8:05 AM | 3.2 | 31.3 km | 1,300 m | Austria | usgs.gov |
| 5/21/08 | 6:39 AM | 3.5 | 40.7 km | 1,400 m | Austria | usgs.gov |
| 9/20/07 | 1:04 PM | 3.5 | 67.4 km | 10,000 m | Austria | usgs.gov |
| 2/22/07 | 10:14 PM | 3.2 | 99.9 km | 5,000 m | Austria | usgs.gov |
| 10/6/05 | 12:23 AM | 3.8 | 73 km | 10,000 m | Austria | usgs.gov |
| 6/29/04 | 3:25 PM | 3.6 | 56.1 km | 10,000 m | Austria | usgs.gov |
| 6/18/04 | 1:10 AM | 3.9 | 48.1 km | 10,000 m | Austria | usgs.gov |
| 8/26/03 | 12:40 PM | 3.3 | 97.6 km | 10,000 m | Austria | usgs.gov |
Find historical earthquake occurrences near Ebensee, Upper Austria
Earliest Date Latest Date
Magnitude 3.0 and greater Magnitude 4.0 and greater Magnitude 5.0 and greater

Ebensee, Upper Austria
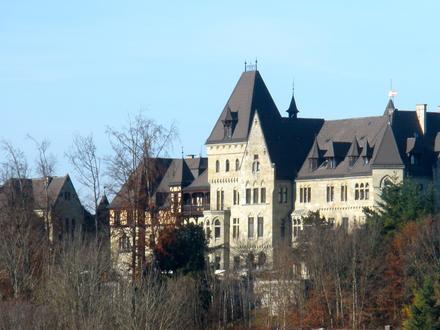
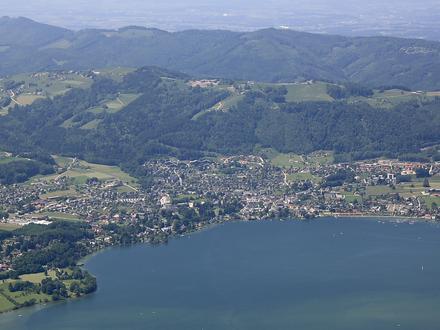
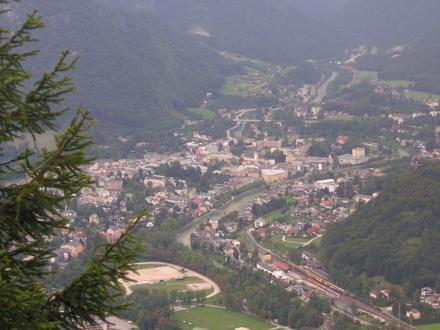
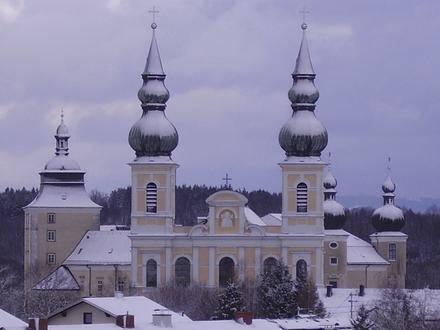
Ebensee is a market town in the Traunviertel region of the Austrian state of Upper Austria, located within the Salzkammergut Mountains at the southern end of the Traunsee. The regional capital Linz lies approximately 90 km (56 mi) to the north, neare.. Ebensee Wikipedia Page
About Our Data
The data on this page is estimated using a number of publicly available tools and resources. It is provided without warranty, and could contain inaccuracies. Use at your own risk. See here for more information.