Businesses in Schiefling am See
Hotels & Travel
Restaurants
Automotive
Financial Services
Medical
Beauty & Spas
Community & Government
Industries
Business Distribution by Industry Hotels & Travel: 29.7%
Industry: 12.5%
Home Services: 8.9%
Restaurants: 7.2%
Shopping: 4.9%
Other: 36.8%
| Industry Description | Number of Establishments | Average Google Rating | Businesses per 1,000 residents |
|---|---|---|---|
| Hostels | 19 | 4.2 | 7.0 |
| Hotels and motels | 13 | 4.3 | 4.8 |
| Other accommodation | 40 | 4.3 | 14.7 |
| Area of Schiefling am See, Carinthia | 28.6 km² |
| Population | 2,717 |
| Male Population | 1,331 (49%) |
| Female Population | 1,386 (51%) |
| Population change from 1975 to 2015 | +61.1% |
| Population change from 2000 to 2015 | +20.8% |
| Median Age | 44 |
| Male Median Age | 43.5 |
| Female Median Age | 44.5 |
| Area Codes | 4273, 4274 |
| Local Time | Sunday 5:20 AM |
| Timezone | Central European Summer Time |
| Lat & Lng | 46.60444° / 14.0975° |
| Postal Codes | 9074, 9535 |
Schiefling am See, Carinthia - Map
Schiefling am See, Carinthia Population
Years 1975 to 2015| Data | 1975 | 1990 | 2000 | 2015 |
|---|---|---|---|---|
| Population | 1,687 | 1,969 | 2,250 | 2,717 |
| Population Density | 58.9 / km² | 68.8 / km² | 78.6 / km² | 94.9 / km² |
Schiefling am See Population change from 2000 to 2015
Increase of 20.8% from year 2000 to 2015| Location | Change since 1975 | Change since 1990 | Change since 2000 |
|---|---|---|---|
| Schiefling am See, Carinthia | +61.1% | +38% | +20.8% |
| Carinthia | -6.9% | -1.5% | -1.3% |
| Austria | +12.1% | +10.9% | +6.1% |
Schiefling am See, Carinthia Median Age
Median Age: 44 years| Location | Median Age | Median Age (Female) | Median Age (Male) |
|---|---|---|---|
| Schiefling am See, Carinthia | 44 years | 44.5 years | 43.5 years |
| Carinthia | 44.4 years | 45.7 years | 43 years |
| Austria | 42.3 years | 43.5 years | 41.1 years |
Schiefling am See, Carinthia Population Tree
Population By Age and Gender| Age | Male | Female | Total |
|---|---|---|---|
| Under 5 | 53 | 68 | 122 |
| 5-9 | 74 | 71 | 145 |
| 10-14 | 67 | 73 | 141 |
| 15-19 | 76 | 62 | 139 |
| 20-24 | 64 | 61 | 125 |
| 25-29 | 68 | 71 | 139 |
| 30-34 | 86 | 88 | 175 |
| 35-39 | 95 | 93 | 189 |
| 40-44 | 118 | 118 | 236 |
| 45-49 | 117 | 106 | 223 |
| 50-54 | 120 | 124 | 244 |
| 55-59 | 94 | 103 | 197 |
| 60-64 | 81 | 88 | 169 |
| 65-69 | 80 | 61 | 142 |
| 70-74 | 58 | 69 | 128 |
| 75-79 | 35 | 46 | 82 |
| 80-84 | 30 | 49 | 80 |
| 85 Plus | 14 | 36 | 50 |
Schiefling am See, Carinthia Population Density
Population Density: 94.9 / km²| Location | Population | Area | Population Density |
|---|---|---|---|
| Schiefling am See, Carinthia | 2,717 | 28.6 km² | 94.9 / km² |
| Carinthia | 556,423 | 9,542.8 km² | 58.3 / km² |
| Austria | 8.5 million | 83,905.5 km² | 101.7 / km² |
Schiefling am See, Carinthia Historical and Projected Population
Estimated Ancient Population until 2100Sources:
1. JRC (European Commission's Joint Research Centre) work on the GHS built-up grid
2. CIESIN (Center for International Earth Science Information Network)
3. [Link] Klein Goldewijk, K., Beusen, A., Doelman, J., and Stehfest, E.: Anthropogenic land use estimates for the Holocene – HYDE 3.2, Earth Syst. Sci. Data, 9, 927–953, https://doi.org/10.5194/essd-9-927-2017, 2017.
Area Codes
Percentage Area Codes used by businesses in Schiefling am See Area Code 4274: 68.7%
Area Code 676: 9%
Area Code 664: 8.2%
Area Code 650: 7.5%
Other: 6.7%
Business distribution by price for Schiefling am See, Carinthia
Inexpensive: 33.3%
Moderate: 33.3%
Expensive: 33.3%
Human Development Index (HDI)
Statistic composite index of life expectancy, education, and per capita income.Sources: [Link] Kummu, M., Taka, M. & Guillaume, J. Gridded global datasets for Gross Domestic Product and Human Development Index over 1990–2015. Sci Data 5, 180004 (2018) doi:10.1038/sdata.2018.4
Schiefling am See, Carinthia CO2 Emissions
Carbon Dioxide (CO2) Emissions Per Capita in Tonnes Per Year| Location | CO2 Emissions | CO2 Emissions Per Capita | CO2 Emissions Intensity |
|---|---|---|---|
| Schiefling am See, Carinthia | 32,516 tn | 12 tn | 1,135 tons/km² |
| Carinthia | 6,280,654 tn | 11.3 tn | 658.2 tons/km² |
| Austria | 91,216,590 tn | 10.7 tn | 1,087 tons/km² |
Schiefling am See, Carinthia CO2 Emissions
| 2013 CO2 emissions (tonnes/year) | 32,516 tn |
| 2013 CO2 emissions (tonnes/year) per capita | 12 tn |
| 2013 CO2 emissions intensity (tonnes/km²/year) | 1,135 tons/km² |
Natural Hazards Risk
Relative risk out of 10| Earthquake | Medium (4) |
* Risk, particularly concerning flood or landslide, may not be for the entire area.
Sources: 1. Dilley, M., R.S. Chen, U. Deichmann, A.L. Lerner-Lam, M. Arnold, J. Agwe, P. Buys, O. Kjekstad, B. Lyon, and G. Yetman. 2005. Natural Disaster Hotspots: A Global Risk Analysis. Washington, D.C.: World Bank. https://doi.org/10.1596/0-8213-5930-4.
2. Center for Hazards and Risk Research - CHRR - Columbia University, Center for International Earth Science Information Network - CIESIN - Columbia University. 2005. Global Earthquake Hazard Distribution - Peak Ground Acceleration. Palisades, NY: NASA Socioeconomic Data and Applications Center (SEDAC). https://doi.org/10.7927/H4BZ63ZS.
Recent Nearby Earthquakes
Magnitude 3.0 and greater| Date | Time | Magnitude | Distance | Depth | Location | Link |
|---|---|---|---|---|---|---|
| 5/29/14 | 12:24 AM | 3.7 | 56.8 km | 6,900 m | 8km W of Cerkno, Slovenia | usgs.gov |
| 2/2/13 | 5:35 AM | 4 | 42 km | 10,000 m | Austria | usgs.gov |
| 3/18/08 | 9:50 PM | 3.3 | 38.5 km | 8,600 m | Austria | usgs.gov |
| 7/15/07 | 9:36 AM | 3.2 | 19.4 km | 10,000 m | Austria | usgs.gov |
| 5/2/07 | 5:49 AM | 3.7 | 36.5 km | 2,000 m | Austria | usgs.gov |
| 1/1/07 | 6:59 AM | 4.2 | 18.4 km | 10,000 m | Austria | usgs.gov |
| 5/19/06 | 7:00 AM | 3.6 | 24.4 km | 10,000 m | Austria | usgs.gov |
| 1/26/06 | 7:42 AM | 3.2 | 30.4 km | 10,000 m | Slovenia | usgs.gov |
| 12/12/05 | 6:14 AM | 3.2 | 61 km | 2,700 m | Slovenia | usgs.gov |
| 8/30/05 | 4:28 AM | 3.1 | 54.9 km | 10,000 m | Slovenia | usgs.gov |
Find historical earthquake occurrences near Schiefling am See, Carinthia
Earliest Date Latest Date
Magnitude 3.0 and greater Magnitude 4.0 and greater Magnitude 5.0 and greater

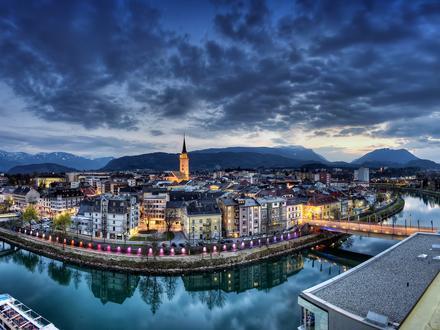
Schiefling am See, Carinthia
Schiefling am See (Slovene: Škofiče) is a market town in the district of Klagenfurt-Land in the Austrian state of Carinthia. Schiefling am See Wikipedia Page
Postal Codes
Percentage of businesses by Postal Codes in Schiefling am See Postal Code 9535: 91%
Postal Code 9220: 8.3%
Other: 0.7%
About Our Data
The data on this page is estimated using a number of publicly available tools and resources. It is provided without warranty, and could contain inaccuracies. Use at your own risk. See here for more information.