Businesses in Wullersdorf
Hotels & Travel
Restaurants
Automotive
Financial Services
Medical
Beauty & Spas
Community & Government
Industries
Business Distribution by Industry Religion: 13.2%
Industry: 12.9%
Professional Services: 11.9%
Shopping: 8.4%
Sports & Activities: 5.8%
Home Services: 5.5%
Food: 5.1%
Medical: 5.1%
Hotels & Travel: 4.8%
Community & Government: 4.8%
Other: 22.5%
| Area of Wullersdorf, Lower Austria | 63.9 km² |
| Population | 2,360 |
| Male Population | 1,188 (50.3%) |
| Female Population | 1,172 (49.7%) |
| Population change from 1975 to 2015 | -10.5% |
| Population change from 2000 to 2015 | -3.2% |
| Median Age | 44.4 |
| Male Median Age | 43.5 |
| Female Median Age | 45.3 |
| Area Codes | 2951, 2953 |
| Local Time | Friday 5:35 PM |
| Timezone | Central European Summer Time |
| Lat & Lng | 48.62792° / 16.10089° |
| Postal Codes | 2022, 2041 |
Wullersdorf, Lower Austria - Map
Wullersdorf, Lower Austria Population
Years 1975 to 2015| Data | 1975 | 1990 | 2000 | 2015 |
|---|---|---|---|---|
| Population | 2,636 | 2,469 | 2,439 | 2,360 |
| Population Density | 41.2 / km² | 38.6 / km² | 38.2 / km² | 36.9 / km² |
Wullersdorf Population change from 2000 to 2015
Decrease of 3.2% from year 2000 to 2015| Location | Change since 1975 | Change since 1990 | Change since 2000 |
|---|---|---|---|
| Wullersdorf, Lower Austria | -10.5% | -4.4% | -3.2% |
| Lower Austria | +10.3% | +9.9% | +5.6% |
| Austria | +12.1% | +10.9% | +6.1% |
Wullersdorf, Lower Austria Median Age
Median Age: 44.4 years| Location | Median Age | Median Age (Female) | Median Age (Male) |
|---|---|---|---|
| Wullersdorf, Lower Austria | 44.4 years | 45.3 years | 43.5 years |
| Lower Austria | 43.4 years | 44.4 years | 42.3 years |
| Austria | 42.3 years | 43.5 years | 41.1 years |
Wullersdorf, Lower Austria Population Tree
Population By Age and Gender| Age | Male | Female | Total |
|---|---|---|---|
| Under 5 | 44 | 40 | 85 |
| 5-9 | 54 | 57 | 111 |
| 10-14 | 63 | 56 | 120 |
| 15-19 | 71 | 61 | 133 |
| 20-24 | 82 | 68 | 150 |
| 25-29 | 64 | 71 | 136 |
| 30-34 | 66 | 57 | 123 |
| 35-39 | 76 | 85 | 161 |
| 40-44 | 106 | 85 | 192 |
| 45-49 | 100 | 103 | 204 |
| 50-54 | 107 | 93 | 201 |
| 55-59 | 81 | 70 | 152 |
| 60-64 | 89 | 92 | 181 |
| 65-69 | 49 | 48 | 97 |
| 70-74 | 59 | 61 | 120 |
| 75-79 | 39 | 48 | 88 |
| 80-84 | 23 | 34 | 57 |
| 85 Plus | 13 | 43 | 57 |
Wullersdorf, Lower Austria Population Density
Population Density: 36.9 / km²| Location | Population | Area | Population Density |
|---|---|---|---|
| Wullersdorf, Lower Austria | 2,360 | 63.9 km² | 36.9 / km² |
| Lower Austria | 1.6 million | 19,195.1 km² | 85.7 / km² |
| Austria | 8.5 million | 83,905.5 km² | 101.7 / km² |
Wullersdorf, Lower Austria Historical Population
Estimated Ancient Population until 2015Sources:
1. JRC (European Commission's Joint Research Centre) work on the GHS built-up grid
2. CIESIN (Center for International Earth Science Information Network)
3. [Link] Klein Goldewijk, K., Beusen, A., Doelman, J., and Stehfest, E.: Anthropogenic land use estimates for the Holocene – HYDE 3.2, Earth Syst. Sci. Data, 9, 927–953, https://doi.org/10.5194/essd-9-927-2017, 2017.
Area Codes
Percentage Area Codes used by businesses in Wullersdorf Area Code 2951: 61.8%
Area Code 2953: 25.5%
Area Code 664: 4.9%
Other: 7.8%
Human Development Index (HDI)
Statistic composite index of life expectancy, education, and per capita income.Sources: [Link] Kummu, M., Taka, M. & Guillaume, J. Gridded global datasets for Gross Domestic Product and Human Development Index over 1990–2015. Sci Data 5, 180004 (2018) doi:10.1038/sdata.2018.4
Wullersdorf, Lower Austria CO2 Emissions
Carbon Dioxide (CO2) Emissions Per Capita in Tonnes Per Year| Location | CO2 Emissions | CO2 Emissions Per Capita | CO2 Emissions Intensity |
|---|---|---|---|
| Wullersdorf, Lower Austria | 26,058 tn | 11 tn | 407.7 tons/km² |
| Lower Austria | 18,266,371 tn | 11.1 tn | 951.6 tons/km² |
| Austria | 91,216,590 tn | 10.7 tn | 1,087 tons/km² |
Wullersdorf, Lower Austria CO2 Emissions
| 2013 CO2 emissions (tonnes/year) | 26,058 tn |
| 2013 CO2 emissions (tonnes/year) per capita | 11 tn |
| 2013 CO2 emissions intensity (tonnes/km²/year) | 407.7 tons/km² |
Natural Hazards Risk
Relative risk out of 10| Flood | Medium (4) |
| Earthquake | Low (2) |
* Risk, particularly concerning flood or landslide, may not be for the entire area.
Sources: 1. Dilley, M., R.S. Chen, U. Deichmann, A.L. Lerner-Lam, M. Arnold, J. Agwe, P. Buys, O. Kjekstad, B. Lyon, and G. Yetman. 2005. Natural Disaster Hotspots: A Global Risk Analysis. Washington, D.C.: World Bank. https://doi.org/10.1596/0-8213-5930-4.
2. Center for Hazards and Risk Research - CHRR - Columbia University, Center for International Earth Science Information Network - CIESIN - Columbia University. 2005. Global Flood Hazard Frequency and Distribution. Palisades, NY: NASA Socioeconomic Data and Applications Center (SEDAC). https://doi.org/10.7927/H4668B3D.
3. Center for Hazards and Risk Research - CHRR - Columbia University, Center for International Earth Science Information Network - CIESIN - Columbia University. 2005. Global Earthquake Hazard Distribution - Peak Ground Acceleration. Palisades, NY: NASA Socioeconomic Data and Applications Center (SEDAC). https://doi.org/10.7927/H4BZ63ZS.
Recent Nearby Earthquakes
Magnitude 3.0 and greater| Date | Time | Magnitude | Distance | Depth | Location | Link |
|---|---|---|---|---|---|---|
| 4/25/16 | 3:28 AM | 4.2 | 60.1 km | 3,460 m | 3km NNE of Heiligenkreuz, Austria | usgs.gov |
| 10/2/13 | 10:17 AM | 3.6 | 78.2 km | 11,550 m | 2km SW of Mitterndorf an der Fischa, Austria | usgs.gov |
| 9/19/13 | 7:06 PM | 4.2 | 83 km | 14,570 m | 1km SSE of Leithaprodersdorf, Austria | usgs.gov |
| 12/6/08 | 6:47 PM | 3.9 | 89.2 km | 10,000 m | Austria | usgs.gov |
| 7/24/05 | 8:06 PM | 4.1 | 92.4 km | 12,100 m | Austria | usgs.gov |
| 12/10/03 | 5:38 PM | 3.3 | 74.9 km | 10,000 m | Austria | usgs.gov |
| 11/22/03 | 5:53 PM | 3.5 | 87.2 km | 5,000 m | Austria | usgs.gov |
| 11/21/01 | 9:10 AM | 3.8 | 71.7 km | 10,000 m | Austria | usgs.gov |
| 6/30/01 | 6:48 PM | 5.1 | 97.7 km | 10,000 m | Austria | usgs.gov |
| 7/12/00 | 2:19 PM | 3.7 | 80.7 km | 10,000 m | Austria | usgs.gov |
Find historical earthquake occurrences near Wullersdorf, Lower Austria
Earliest Date Latest Date
Magnitude 3.0 and greater Magnitude 4.0 and greater Magnitude 5.0 and greater
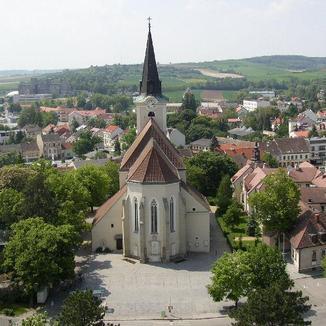
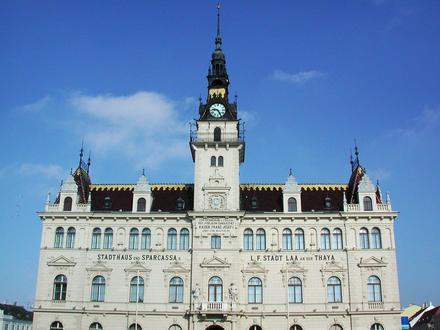
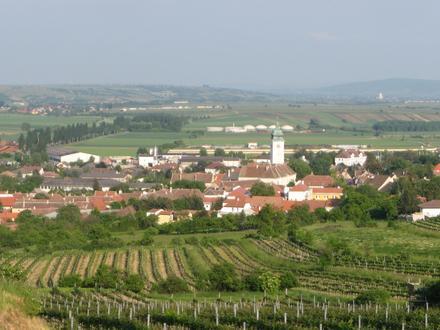
Wullersdorf, Lower Austria
Wullersdorf is a town in the district of Hollabrunn in Lower Austria, Austria. Wullersdorf Wikipedia Page
Postal Codes
Percentage of businesses by Postal Codes in Wullersdorf Postal Code 2041: 74.1%
Postal Code 2022: 13.4%
Postal Code 2023: 6.2%
Postal Code 2042: 6.2%
About Our Data
The data on this page is estimated using a number of publicly available tools and resources. It is provided without warranty, and could contain inaccuracies. Use at your own risk. See here for more information.