Businesses in Shabla Municipality
Hotels & Travel
Restaurants
Automotive
Financial Services
Medical
Beauty & Spas
Community & Government
Industries
Business Distribution by Industry Hotels & Travel: 26%
Restaurants: 14.7%
Shopping: 12.9%
Industry: 11.1%
Food: 9.3%
Other: 26%
| Industry Description | Number of Establishments | Average Google Rating | Businesses per 1,000 residents |
|---|---|---|---|
| Bed and breakfasts | 6 | 4.4 | 2.3 |
| Campgrounds | 6 | 4.1 | 2.3 |
| Hotels and motels | 12 | 4.3 | 4.6 |
| Other accommodation | 15 | 4.3 | 5.8 |
| Area of Shabla Municipality, Dobrich Province | 329.6 km² |
| Population | 2,584 |
| Male Population | 1,275 (49.4%) |
| Female Population | 1,309 (50.6%) |
| Population change from 1975 to 2015 | -36.4% |
| Population change from 2000 to 2015 | -20.2% |
| Median Age | 50.8 |
| Male Median Age | 47.7 |
| Female Median Age | 53.8 |
| Area Codes | 5743 |
| Local Time | Sunday 6:26 AM |
| Timezone | Eastern European Summer Time |
| Lat & Lng | 43.53333° / 28.53333° |
| Postal Codes | 9680 |
Shabla Municipality, Dobrich Province - Map
Shabla Municipality, Dobrich Province Population
Years 1975 to 2015| Data | 1975 | 1990 | 2000 | 2015 |
|---|---|---|---|---|
| Population | 4,065 | 3,801 | 3,237 | 2,584 |
| Population Density | 12.3 / km² | 11.5 / km² | 9.82 / km² | 7.84 / km² |
Shabla Municipality Population change from 2000 to 2015
Decrease of 20.2% from year 2000 to 2015| Location | Change since 1975 | Change since 1990 | Change since 2000 |
|---|---|---|---|
| Shabla Municipality, Dobrich Province | -36.4% | -32% | -20.2% |
| Dobrich | -30.9% | -28.4% | -17.6% |
| Bulgaria | -18% | -19% | -10.6% |
Shabla Municipality, Dobrich Province Median Age
Median Age: 50.8 years| Location | Median Age | Median Age (Female) | Median Age (Male) |
|---|---|---|---|
| Shabla Municipality, Dobrich Province | 50.8 years | 53.8 years | 47.7 years |
| Dobrich | 43.4 years | 45.2 years | 41.6 years |
| Bulgaria | 42.8 years | 44.8 years | 40.6 years |
Shabla Municipality, Dobrich Province Population Tree
Population By Age and Gender| Age | Male | Female | Total |
|---|---|---|---|
| Under 5 | 51 | 39 | 91 |
| 5-9 | 46 | 36 | 83 |
| 10-14 | 50 | 49 | 100 |
| 15-19 | 53 | 55 | 108 |
| 20-24 | 69 | 60 | 129 |
| 25-29 | 66 | 45 | 111 |
| 30-34 | 72 | 52 | 124 |
| 35-39 | 83 | 82 | 165 |
| 40-44 | 97 | 80 | 177 |
| 45-49 | 96 | 90 | 187 |
| 50-54 | 104 | 88 | 192 |
| 55-59 | 101 | 94 | 196 |
| 60-64 | 108 | 122 | 231 |
| 65-69 | 83 | 131 | 215 |
| 70-74 | 71 | 111 | 182 |
| 75-79 | 70 | 95 | 166 |
| 80-84 | 37 | 50 | 88 |
| 85 Plus | 19 | 29 | 48 |
Shabla Municipality, Dobrich Province Population Density
Population Density: 7.84 / km²| Location | Population | Area | Population Density |
|---|---|---|---|
| Shabla Municipality, Dobrich Province | 2,584 | 329.6 km² | 7.84 / km² |
| Dobrich | 179,084 | 4,718.2 km² | 38.0 / km² |
| Bulgaria | 7.1 million | 110,897.7 km² | 64.0 / km² |
Shabla Municipality, Dobrich Province Historical and Projected Population
Estimated Ancient Population until 2100Sources:
1. JRC (European Commission's Joint Research Centre) work on the GHS built-up grid
2. CIESIN (Center for International Earth Science Information Network)
3. [Link] Klein Goldewijk, K., Beusen, A., Doelman, J., and Stehfest, E.: Anthropogenic land use estimates for the Holocene – HYDE 3.2, Earth Syst. Sci. Data, 9, 927–953, https://doi.org/10.5194/essd-9-927-2017, 2017.
Area Codes
Percentage Area Codes used by businesses in Shabla Municipality Area Code 57: 32.6%
Area Code 88: 27.9%
Area Code 89: 18.6%
Area Code 87: 16.3%
Other: 4.7%
Business distribution by price for Shabla Municipality, Dobrich Province
Moderate: 61.5%
Expensive: 23.1%
Inexpensive: 15.4%
Human Development Index (HDI)
Statistic composite index of life expectancy, education, and per capita income.Sources: [Link] Kummu, M., Taka, M. & Guillaume, J. Gridded global datasets for Gross Domestic Product and Human Development Index over 1990–2015. Sci Data 5, 180004 (2018) doi:10.1038/sdata.2018.4
Shabla Municipality, Dobrich Province CO2 Emissions
Carbon Dioxide (CO2) Emissions Per Capita in Tonnes Per Year| Location | CO2 Emissions | CO2 Emissions Per Capita | CO2 Emissions Intensity |
|---|---|---|---|
| Shabla Municipality, Dobrich Province | 10,354 tn | 4.01 tn | 31.4 tons/km² |
| Dobrich | 714,467 tn | 3.99 tn | 151.4 tons/km² |
| Bulgaria | 31,066,755 tn | 4.37 tn | 280.1 tons/km² |
Shabla Municipality, Dobrich Province CO2 Emissions
| 2013 CO2 emissions (tonnes/year) | 10,354 tn |
| 2013 CO2 emissions (tonnes/year) per capita | 4.01 tn |
| 2013 CO2 emissions intensity (tonnes/km²/year) | 31.4 tons/km² |
Natural Hazards Risk
Relative risk out of 10| Drought | Low (2) |
| Flood | High (7) |
| Earthquake | Medium (4) |
* Risk, particularly concerning flood or landslide, may not be for the entire area.
Sources: 1. Dilley, M., R.S. Chen, U. Deichmann, A.L. Lerner-Lam, M. Arnold, J. Agwe, P. Buys, O. Kjekstad, B. Lyon, and G. Yetman. 2005. Natural Disaster Hotspots: A Global Risk Analysis. Washington, D.C.: World Bank. https://doi.org/10.1596/0-8213-5930-4.
2. Center for Hazards and Risk Research - CHRR - Columbia University, Center for International Earth Science Information Network - CIESIN - Columbia University. 2005. Global Flood Hazard Frequency and Distribution. Palisades, NY: NASA Socioeconomic Data and Applications Center (SEDAC). https://doi.org/10.7927/H4668B3D.
3. Center for Hazards and Risk Research - CHRR - Columbia University, Center for International Earth Science Information Network - CIESIN - Columbia University. 2005. Global Earthquake Hazard Distribution - Peak Ground Acceleration. Palisades, NY: NASA Socioeconomic Data and Applications Center (SEDAC). https://doi.org/10.7927/H4BZ63ZS.
4. Center for Hazards and Risk Research - CHRR - Columbia University, Center for International Earth Science Information Network - CIESIN - Columbia University, and International Research Institute for Climate and Society - IRI - Columbia University. 2005. Global Drought Hazard Frequency and Distribution. Palisades, NY: NASA Socioeconomic Data and Applications Center (SEDAC). https://doi.org/10.7927/H4VX0DFT.
Recent Nearby Earthquakes
Magnitude 3.0 and greater| Date | Time | Magnitude | Distance | Depth | Location | Link |
|---|---|---|---|---|---|---|
| 7/15/15 | 1:30 AM | 3.8 | 18.8 km | 20,400 m | 18km S of Shabla, Bulgaria | usgs.gov |
| 8/12/13 | 11:14 PM | 3.9 | 96.1 km | 2,000 m | 8km SE of Provadiya, Bulgaria | usgs.gov |
| 12/3/12 | 10:58 AM | 4.5 | 13.7 km | 10,000 m | Black Sea | usgs.gov |
| 10/7/10 | 12:51 PM | 4.4 | 93.6 km | 10,000 m | Bulgaria | usgs.gov |
| 8/5/09 | 12:49 AM | 5 | 16 km | 10,000 m | Black Sea | usgs.gov |
| 11/4/08 | 11:36 PM | 4.1 | 97.9 km | 10,000 m | Bulgaria | usgs.gov |
| 8/24/06 | 2:00 PM | 3.8 | 24.8 km | 32,700 m | Black Sea | usgs.gov |
| 12/17/03 | 3:15 PM | 4.4 | 98.6 km | 33,900 m | Bulgaria | usgs.gov |
| 4/19/97 | 2:00 PM | 3.6 | 68.1 km | 10,000 m | Black Sea | usgs.gov |
| 8/22/94 | 11:47 PM | 3.4 | 79.7 km | 10,000 m | Black Sea | usgs.gov |
Find historical earthquake occurrences near Shabla Municipality, Dobrich Province
Earliest Date Latest Date
Magnitude 3.0 and greater Magnitude 4.0 and greater Magnitude 5.0 and greater

Shabla Municipality, Dobrich Province
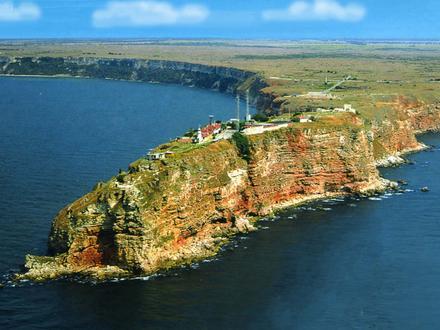
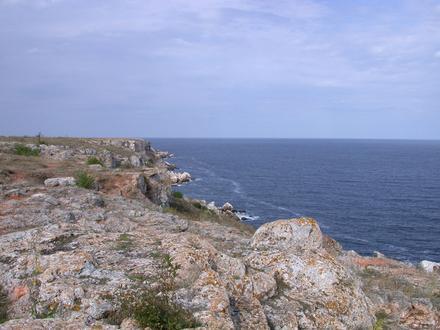
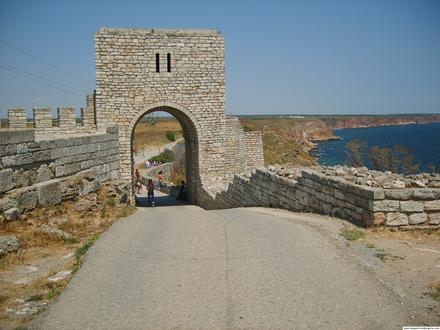
Shabla Municipality (Bulgarian: Община Шабла) is a municipality (obshtina) in Dobrich Province, Bulgaria, located in the north-easternmost part of the country on the Northern Bulgarian Black Sea Coast in Southern Dobruja geographical region, bounded .. Shabla Municipality Wikipedia Page
Postal Codes
Percentage of businesses by Postal Codes in Shabla Municipality Postal Code 9680: 68.9%
Postal Code 9674: 11.1%
Postal Code 9670: 6.7%
Postal Code 9684: 6.7%
Other: 6.7%

About Our Data
The data on this page is estimated using a number of publicly available tools and resources. It is provided without warranty, and could contain inaccuracies. Use at your own risk. See here for more information.