Businesses in Tanguiéta
| Area of Tanguiéta, Atakora Department | 5,465 km² |
| Population | 65,735 |
| Population change from 1975 to 2015 | +152.1% |
| Population change from 2000 to 2015 | +30.9% |
| Area Codes | 23 83 |
| Local Time | Sunday 4:22 AM |
| Timezone | West Africa Standard Time |
| Lat & Lng | 10.62118° / 1.26651° |
Tanguiéta, Atakora Department - Map
Tanguiéta, Atakora Department Population
Years 1975 to 2015| Data | 1975 | 1990 | 2000 | 2015 |
|---|---|---|---|---|
| Population | 26,077 | 38,267 | 50,203 | 65,735 |
| Population Density | 4.77 / km² | 7.0 / km² | 9.19 / km² | 12.0 / km² |
Tanguiéta Population change from 2000 to 2015
Increase of 30.9% from year 2000 to 2015| Location | Change since 1975 | Change since 1990 | Change since 2000 |
|---|---|---|---|
| Tanguiéta, Atakora Department | +152.1% | +71.8% | +30.9% |
| Atakora Department | +217.9% | +101.2% | +46.7% |
| Benin | +233.9% | +118% | +56.5% |
Tanguiéta, Atakora Department Population Density
Population Density: 12.0 / km²| Location | Population | Area | Population Density |
|---|---|---|---|
| Tanguiéta, Atakora Department | 65,735 | 5,465 km² | 12.0 / km² |
| Atakora Department | 907,655 | 21,249.8 km² | 42.7 / km² |
| Benin | 10.8 million | 115,295.3 km² | 93.7 / km² |
Tanguiéta, Atakora Department Historical and Projected Population
Estimated Population from 900 to 2100Sources:
1. JRC (European Commission's Joint Research Centre) work on the GHS built-up grid
2. CIESIN (Center for International Earth Science Information Network)
3. [Link] Klein Goldewijk, K., Beusen, A., Doelman, J., and Stehfest, E.: Anthropogenic land use estimates for the Holocene – HYDE 3.2, Earth Syst. Sci. Data, 9, 927–953, https://doi.org/10.5194/essd-9-927-2017, 2017.
Human Development Index (HDI)
Statistic composite index of life expectancy, education, and per capita income.Sources: [Link] Kummu, M., Taka, M. & Guillaume, J. Gridded global datasets for Gross Domestic Product and Human Development Index over 1990–2015. Sci Data 5, 180004 (2018) doi:10.1038/sdata.2018.4
Tanguiéta, Atakora Department CO2 Emissions
Carbon Dioxide (CO2) Emissions Per Capita in Tonnes Per Year| Location | CO2 Emissions | CO2 Emissions Per Capita | CO2 Emissions Intensity |
|---|---|---|---|
| Tanguiéta, Atakora Department | 37,995 tn | 0.58 tn | 6.95 tons/km² |
| Atakora Department | 497,067 tn | 0.55 tn | 23.4 tons/km² |
| Benin | 5,965,281 tn | 0.55 tn | 51.7 tons/km² |
Tanguiéta, Atakora Department CO2 Emissions
| 2013 CO2 emissions (tonnes/year) | 37,995 tn |
| 2013 CO2 emissions (tonnes/year) per capita | 0.58 tn |
| 2013 CO2 emissions intensity (tonnes/km²/year) | 6.95 tons/km² |
Natural Hazards Risk
Relative risk out of 10| Drought | Medium (5) |
| Flood | Medium (4) |
* Risk, particularly concerning flood or landslide, may not be for the entire area.
Sources: 1. Dilley, M., R.S. Chen, U. Deichmann, A.L. Lerner-Lam, M. Arnold, J. Agwe, P. Buys, O. Kjekstad, B. Lyon, and G. Yetman. 2005. Natural Disaster Hotspots: A Global Risk Analysis. Washington, D.C.: World Bank. https://doi.org/10.1596/0-8213-5930-4.
2. Center for Hazards and Risk Research - CHRR - Columbia University, Center for International Earth Science Information Network - CIESIN - Columbia University, and International Research Institute for Climate and Society - IRI - Columbia University. 2005. Global Drought Hazard Frequency and Distribution. Palisades, NY: NASA Socioeconomic Data and Applications Center (SEDAC). https://doi.org/10.7927/H4VX0DFT.
3. Center for Hazards and Risk Research - CHRR - Columbia University, Center for International Earth Science Information Network - CIESIN - Columbia University. 2005. Global Flood Hazard Frequency and Distribution. Palisades, NY: NASA Socioeconomic Data and Applications Center (SEDAC). https://doi.org/10.7927/H4668B3D.

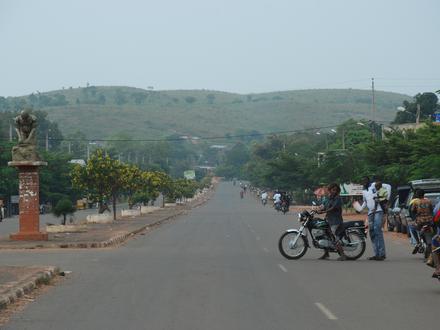
Tanguiéta, Atakora Department
Tanguiéta is a town, arrondissement and commune located in the Atakora Department of Benin.The commune covers an area of 5465 square kilometres and as of 2002 had a population of 54,719 people. As of 2007 the town had an estimated population of 21,29.. Tanguiéta Wikipedia Page

About Our Data
The data on this page is estimated using a number of publicly available tools and resources. It is provided without warranty, and could contain inaccuracies. Use at your own risk. See here for more information.